- The Sovereign Signal
- Posts
- 13M bpd Offline, COMEX Registered Silver Down 68%, Shanghai Vaults Bleeding, Indonesia Hiking Nickel, and Global Debt at Records: Owning Constraints in a Breaking Regime
13M bpd Offline, COMEX Registered Silver Down 68%, Shanghai Vaults Bleeding, Indonesia Hiking Nickel, and Global Debt at Records: Owning Constraints in a Breaking Regime
We are living through a record‐scale oil shock that official models still mis-frame as a traffic jam, with 1‐plus billion barrels quietly erased from a system already burdened by the largest debt and leverage stack in history and the thinnest equity‐market exit we’ve ever recorded. COMEX silver’s 68% registered drain, Shanghai’s brutal multi‐month vault bleed and record import surge, and SHFE’s margin hikes are all facets of the same story.
Luke Lovett
April 15, 2026
1. The Setup: A Record Oil Shock in a Record Debt World
Start with the scale, because everything else is downstream of this.
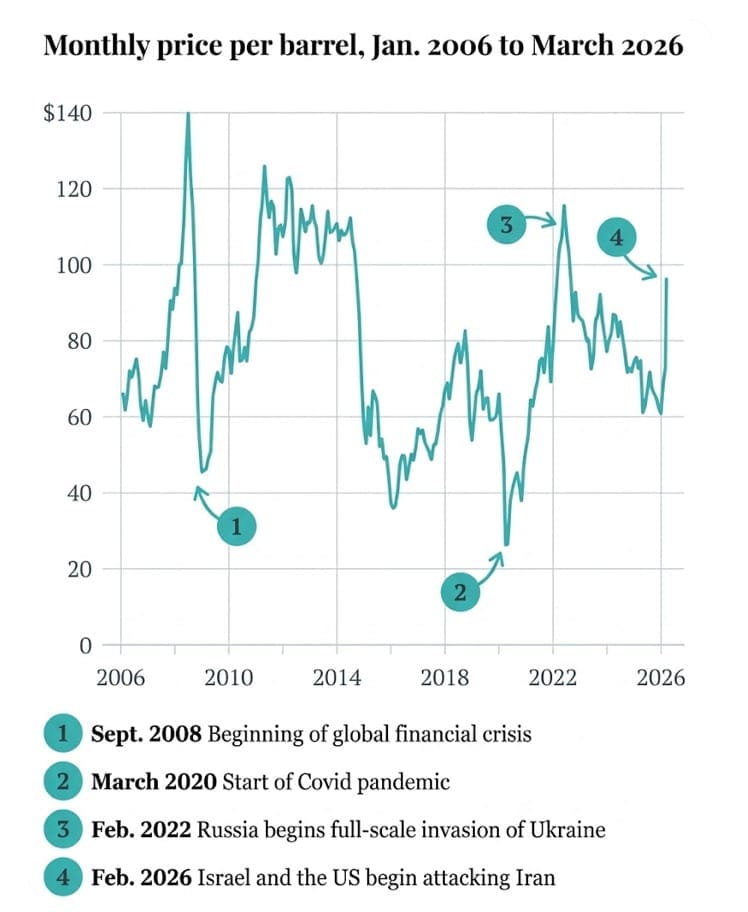
Specialists now converge on the same basic math: the current Middle East conflict has taken on the order of 1+ billion barrels out of the system over time, with estimates of roughly 13 million barrels per day offline at points and further tightness as pre‑war cargoes roll off.
Oil people are not arguing with each other about the sign or the magnitude; they are only arguing about how long it lasts.
By contrast, generalists and official institutions are still anchored to a far milder story.
The IMF has just cut its 2026 global growth forecast to around the low‑3s, explicitly citing the Iran war and higher energy prices, but its “reference” case assumes a short conflict and Brent averaging in the low‑80s for the year—below where the strip is already trading and far below what a 1+ billion‑barrel hole argues for.
IMF officials are already hinting that their own adverse scenario is becoming more realistic, which tells you how stale the baseline is on arrival.
Overlay that on the largest debt and leverage supercycle in history.
Global debt sits near the mid‑$300 trillions. Sovereign balance sheets are running wartime‑scale deficits into full employment.
At the same time, market structure data say global equity market cap is roughly 6–8x larger than the cash‑like liquidity that can take the other side.
In practical terms: if you have $1m in public equities, there might be only $125–170k of true, patient exit liquidity willing to catch you at anything like current marks.
This is the core tension:
A record oil shock that wants to push prices, inflation, and nominal revenues higher,
Sitting on top of a record debt tower that can only be rolled peacefully at low real yields and docile volatility,
In a market structure where there is simply not enough balance‑sheet capacity to let everyone de‑risk at once.
2. Oil: Mis-framed by Generalists, Underpriced by Models
The best nuance coming out of the specialist community is about where the shock actually sits.
Generalists are still thinking in terms of Strait of Hormuz traffic: if tanker flows resume, the problem is “fixed.”
Oil specialists insist that this is the wrong frame.
The bulk of the damage is not queued‑up tankers; it is production shut‑ins and the forced draw‑down of storage elsewhere to compensate.
Source: The Energy Data Scientist
Even if shipping resumes, the barrels lost during the outage are gone.
On their math, that’s 1+ billion barrels that must be made up via inventories and future production.
In “normal” times, a 1–2 million bpd imbalance is the difference between $50 and $75 WTI.
In this environment, specialists argue, the outage is so large that an extra 1–2 million bpd either way barely moves the strategic picture; it only changes how quickly inventories exhaust.
That explains why they’re so unbothered by small week‑to‑week revisions and so focused on the duration of the conflict.
Crucially, sentiment will not flip until something visceral breaks: visible fuel shortages, rationing, localized outages.
Until then, futures curves and official forecasts will cling to the “traffic jam” narrative. For investors, that lag is the opportunity and the risk. It means:
Energy equities, long‑dated oil, and critical upstream service capacity are still not priced for “largest shock on record.”
The inflation impulse and margin squeeze that follow have not yet been fully mapped onto earnings and credit spreads.
Policymakers will arrive late, torn between validating higher nominal prices (to keep the system solvent) and resisting the political pain of higher inflation.
3. Silver: When the Collateral Layer Starts to Creak
Against that energy backdrop, the behavior of silver over the last several days looks less like a sideshow and more like the canary in the collateral mine.
You have multiple independent pieces of evidence:
Price structure: Silver has broken out of a long‑term descending channel, a technical lid that has capped rallies for years, and is now holding above the breakout.
The pattern is no longer “spike and fade”; it is “break, retest, hold.”
Delivery behavior: Open interest in the April COMEX contract is jumping in the delivery month.
More participants are choosing to stand for metal rather than roll paper forward.
Western inventories: COMEX silver vault inventories have slipped to fresh 15‑month lows, with daily draws on the order of 1.3 million ounces (40+ tons).
More broadly, registered COMEX silver has fallen from roughly 240 million ounces in 2020 to about 77 million in 2026—a 68% collapse in the stock explicitly earmarked to meet delivery.

Source: Metal Charts
Chinese inventories: In Shanghai, after a brutal multi‑year drawdown, SGE + SHFE vaults have just ticked higher—a modest but clear move off the lows.
China is nibbling metal back into the system at the margin even as COMEX bleeds.
Policy reaction: The Shanghai Futures Exchange has raised margins on gold and silver futures (to ~high‑teens / low‑20s percentages) and widened trading limits, explicitly to “cool volatility” and tighten control over metals trading.
If you put those together, you get a very specific dynamic:
The price of silver is starting to escape its long‑term suppression channel just as
Western exchange inventories that anchor the credibility of paper claims have been hollowed out over six years and continue to leak, while
Eastern vaults, after a massive multi‑month drawdown, have only just shown a small weekly uptick off very low levels—more a tactical pause in the drain than genuine restocking—and
Regulators raise margins, prune leverage, and try to manage the coming volatility.
In a world where the global financial system is effectively a claims pyramid balanced on a shrinking base of energy and metals, this is exactly how early‑stage stress shows up: not as a public default, but as small changes in who is willing to roll, who insists on delivery, and how much inventory is actually available to make paper whole.
The key nuance: this is not a Reddit‑style “squeeze” story.
It is the slow recognition that silver is shifting from high‑beta risk asset back toward monetary collateral and strategic input—at the precise moment when energy shocks are raising its cost of production and capital is hunting for things that are nobody’s liability.
Access the Signal Behind the Distortion
Debt-fueled distortions are warping stocks, credit, and global liquidity. We track the structural signals building beneath the surface — gold, silver, and the asymmetric setups mainstream coverage overlooks.
Already a paying subscriber? Sign In.
Reply