- The Sovereign Signal
- Posts
- 223% Valuations. 701 Leverage. 10% of Silver Shorted. The Setup.
223% Valuations. 701 Leverage. 10% of Silver Shorted. The Setup.
Record-high Buffett Indicator and retail leverage collide with a five-year, 2.6σ gold-to-silver mispricing, a structural silver deficit, and a Dow:silver breakdown—priming a sharp rotation from overvalued, levered equities into scarce monetary silver.
Luke Lovett
October 27, 2025
As of October 15th, there is a “monster new record high short position in SLV.”
Traders are borrowing SLV shares and dumping them because getting real bars is hard. It’s the quickest way to push price without finding silver.

What’s an EFP?
Exchange for Physical = a swap where a futures position (COMEX) is exchanged for physical/LBMA exposure. The EFP spread is roughly COMEX price – LBMA price (plus costs).
Signal just flipped: COMEX > LBMA.
EFPs now positive (Dec +$0.02, Mar +$0.60, May +$0.96).
Shipping silver to London no longer pays—U.S. ounces are tighter.
Meanwhile, the SLV short is a powder keg: 83.86M shares short (up 54% in two weeks) = ~10% of annual mine supply and 15.18% of SLV.
Tight deliverables + crowded ETF short = one-way risk. If price nudges higher or borrow tightens, shorts must chase fewer ounces. Translation: pressure down was paper; pressure up can be a squeeze.

Gold/Silver ratio is screaming.
Why it’s stretched:
Gold got the reserve bid (central banks, safety). Silver got starved—under-mined, mostly by-product, sat on by paper shorts—while factory demand (solar/EVs) exploded.
Why now:
Stress pushes money to base collateral → gold first. But inventories are thin and Asia’s paying up, so the next workable ounce is silver—cheap per unit, scarce in float, now turning into bank collateral in places.
What usually happens next:
Ratios this extreme snap back. With gold already strong, the catch-up comes from silver moving faster (small market + tight supply).
Translation:
Not “gold rich”—silver mispriced. In a leveraged world hunting real collateral, a small bid can move silver a long way.
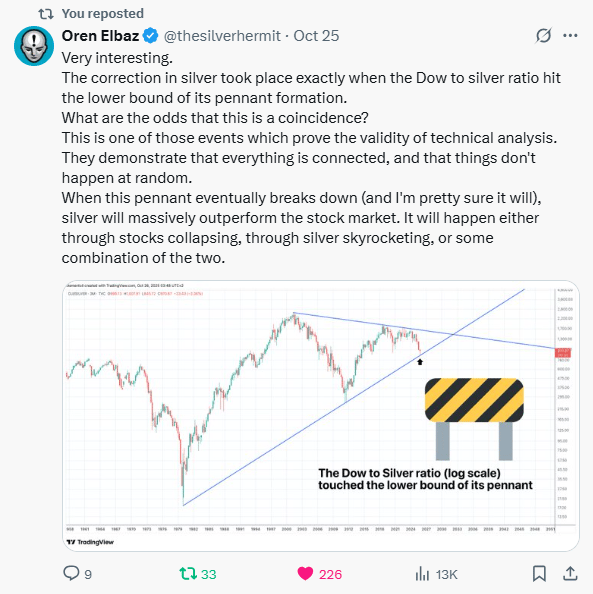
Why this Dow/Silver chart matters—now
The ratio just kissed the bottom of a long pennant exactly as: funding costs rose, equity liquidity thinned, and physical silver got tighter (Asia premiums, falling inventories, new “silver-as-collateral” rules).
That mix pulls stocks toward lower multiples while it pulls silver toward real-asset pricing—two forces pressing the ratio down from both sides.
In leverage terms: crowded, credit-dependent equities = fragile; small cash bids for scarce metal = powerful.
If the pennant cracks lower, outperformance can come via stocks slipping, silver ripping, or some of both—the math doesn’t care which.
Read-through: markets are rotating from paper promises to collateral. Owning some silver is a bet that this rotation is just getting started.
Signal | Latest Level | Interpretation | Zone |
|---|---|---|---|
10-Year Swap Spread | −16.03 bps | Still negative → swaps > cash Treasuries; funding/credit tension persists. | 🟠 Orange |
3-Year SOFR–OIS | 30.2 bps | Elevated; mid-term funding stress still present. | 🔴 Red |
UST–JGB 10-Year | 2.354% | Wide trans-Pacific gap fuels basis/carry distortions. | 🟠 Orange |
Reverse Repos (RRP) | $2.435B | Safety valve near empty → little spare cash buffer. | 🔴 Red |
USD/JPY | 152.79 | Carry trade supercharging; unwind risk building. | 🔴 Red |
USD/CHF | 0.796 | Bid for “hardest fiat” persists; safety flows. | 🔴 Red |
SOFR Overnight | 4.24% | High carry / tighter overnight funding. | 🟠 Orange |
SLV Borrow (fee / avail / rebate) | 2.92% / 3.0M / 1.19% | Easier to borrow vs. days prior; shorts still active but pressure eased. | 🟠 Orange |
COMEX Silver Registered | 167.7M oz | Low vs. history; thin deliverable float. | 🔴 Red |
COMEX Silver Volume | 78,407 | Quiet tape; longs cautious, easier to push price. | 🟡 Yellow |
COMEX Silver Open Interest | 164,523 | Moderate positioning; room for squeeze expansion. | 🟡 Yellow |
GLD Borrow (fee / avail / rebate) | 0.58% / 6.7M / 3.53% | Ample shares; shorting cheaper than recent peaks. | 🟡 Yellow |
COMEX Gold Registered | 19.95M oz | Tight deliverable pool keeps premia sticky. | 🟠 Orange |
COMEX Gold Volume | 313,806 | Subdued flow; volatility can gap. | 🟡 Yellow |
COMEX Gold Open Interest | 475,113 | Solid participation; susceptible to funding shocks. | 🟠 Orange |
Japan 30-Year JGB | 3.076% | Slow grind higher stresses JGB convexity/carry. | 🔴 Red |
US 30-Year UST | 4.022% | Long-end relief bounce but still tight financial conditions. | 🟡 Yellow |

Silver’s story in one breath: we burned the surplus and kept the demand.
2016–2020 ran on leftovers; 2021–2025 is running on empty.
Solar/EV build-outs, chip/electronics growth, and rising monetary demand pulled ounces out faster than mines can replace them.
Supply can’t sprint—grades are falling, capex lagged for years, most silver is a by-product (you can’t just “turn it up”), and permits/refining are chokepoints.
Meanwhile Asia’s premiums, vault drawdowns, and new “silver as bank collateral” rules are locking metal away from the trading float.
Result: structural deficit + tiny available inventory.
In a market priced by paper but settled by bars, that’s explosive leverage—small real dollars can move price a long way, and dips get bought because shelves don’t refill.
Wake up: this isn’t a headline cycle; it’s a regime change from surplus to scarcity. In a world built on leverage, owning scarce collateral wins.

Buffett Indicator at 223% = stocks priced miles above the economy. Why now?
Because the system’s been running on leverage and liquidity: decade of cheap money, record deficits, buybacks, passive flows, options/gamma, and yen-carry fuel push prices faster than GDP can grow.
Add AI euphoria + off-exchange routing (dark liquidity), and quotes float higher on thinner real bids.
Implication: tiny shocks = big air-pockets. When funding tightens (SOFR wiggles, repo taps), there’s little margin of safety left.
Positive takeaway: extremes create rotation moments.
Trim the most levered winners; add base-layer collateral (gold/monetary silver) and cash-flow assets with real margins.
In a market priced on promises, own a few things that don’t need one.
Wake up: this is the late-cycle signal, not a victory lap.
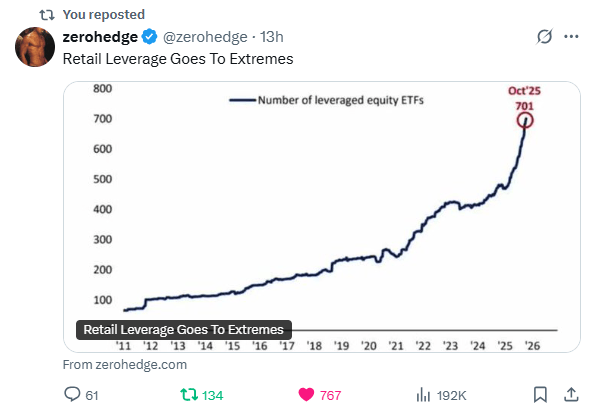
Why retail leverage is exploding
The bait: Fees on levered ETFs are juicy, apps gamify trading, and social feeds sell “instant wins.”
The habit: A decade of buy-the-dip taught everyone to floor it on every wobble.
The math: Inflation punishes cash, so people chase speed.
The illusion: Dark pools, 0 days to expiration options, and internalization make liquidity look endless—right up to the edge.
The story: With debt at records, narratives beat spreadsheets; folks rent beta with boosters.
What that means:
Leverage drags tomorrow’s gains into today and leaves air pockets. When volatility jumps, forced deleveraging can turn a dip into a cliff.
Plain English:
We’re doing 120 mph on an empty-looking freeway. It’s fine—until fog.
The setup (positive):
When the margin clerk knocks, paper sells first. Unlevered, scarce collateral—gold and monetary silver—gets scooped cheap… and snaps back hardest.
Why I Use HardAssets Alliance
HardAssets Alliance provides:
100% insurance of metals for market value
Institutional-grade daily audits and security
Best pricing — live bids from global wholesalers
Fully allocated metal — in your name, your bars
Delivery anytime or vault-secured across 5 global hubs
Luke Lovett
Cell: 704.497.7324
Undervalued Assets | Sovereign Signal
Email: [email protected]
Disclaimer:
This content is for educational purposes only—not financial, legal, tax, or investment advice. I’m not a licensed advisor, and nothing herein should be relied upon to make investment decisions. Markets change fast. While accuracy is the goal, no guarantees are made. Past performance ≠ future results. Some insights paraphrase third-party experts for commentary—without endorsement or affiliation. Always do your own research and consult a licensed professional before investing. I do not sell metals, process transactions, or hold funds. All orders go directly through licensed dealers.
Reply