- The Sovereign Signal
- Posts
- IMF Says Debt to 100% of GDP by 2029, 95% of Reserve Managers Are Buying Gold, The US Carries Gold at $42.22 While It Trades Near $4,800, Airlines Cancelling Guidance on $200 Jet Fuel, and a Third of Fertilizers ‘At Risk’ - The Repricing That Will Blindside Anyone Trusting the Index
IMF Says Debt to 100% of GDP by 2029, 95% of Reserve Managers Are Buying Gold, The US Carries Gold at $42.22 While It Trades Near $4,800, Airlines Cancelling Guidance on $200 Jet Fuel, and a Third of Fertilizers ‘At Risk’ - The Repricing That Will Blindside Anyone Trusting the Index
The gap between our portfolios and the physical world is now measurable in trillions—and closing fast.
Luke Lovett
April 21, 2026

Markets look calm for a system that just quietly rewrote its own balance sheet.
The IMF now projects global public debt will hit roughly 100% of GDP by 2029, with interest payments climbing from about 3% of global output to around 5% by 2031 as governments refinance at today’s higher rates.
At the same time, the S&P 500 equal‑weight ETF is on track for its largest monthly outflow on record as money sprints back into a handful of mega‑caps, and the issuer of the reserve currency is sitting on more than a trillion dollars of unrecognized gold gains that almost no model bothers to price.
If that is “efficient price discovery,” it has a strange way of showing it.
1. When the tape stops doing its job
We start with equities.
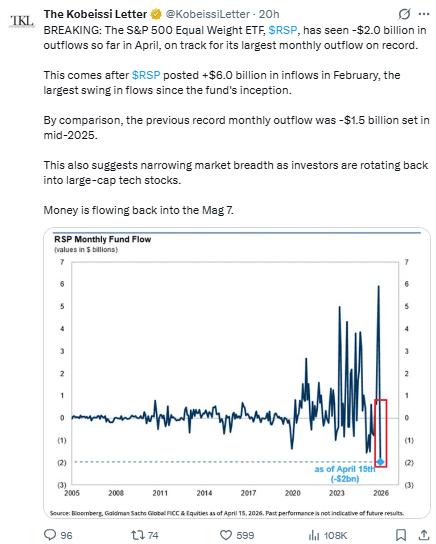
So far in April, the S&P 500 Equal Weight ETF has seen about 2 billion dollars in outflows and is on pace for the biggest monthly redemption since the fund launched.
That comes barely a month after roughly 6 billion dollars rushed into the same vehicle in February, the largest positive flow in its history, meaning breadth has gone from “everyone loves the average stock” to “get us back into the winners” in record time.
The prior record for monthly outflows was about 1.5 billion in mid‑2025; we are already past that.
Those flows are telling us something the index level hides.
Investors no longer trust the market as a mechanism for discovering value in the median business; they trust it as a levered bet on the same small group of names that already dominate market cap and narrative.
That is not a market sifting through information and clearing prices.
It is a crowd clustering in the one corner of the room where the music is still playing, hoping the exits stay open.
We see the same failure of price discovery in commodities.
Citadel’s head of commodities just admitted that Donald Trump’s social media posts during the Iran war have “transformed how oil markets behave,” leaving traders struggling to cope with the volatility his frequent messages inject.
If the marginal barrel is priced by the timing and tone of presidential posts rather than by supply, demand, and inventory, then the tape is not discovering value; it is being jerked around by a notification stream.
In both equities and oil, the mechanism that is supposed to aggregate information has been captured by flows and noise.
And when the mechanism stops doing its job, price discovery does not disappear. It moves somewhere else.
2. Price discovery moved into our power bill and grocery list
The first place it shows up is on our utility statement.
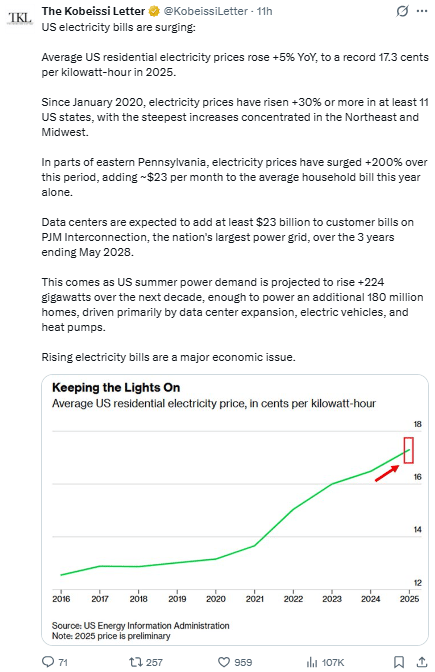
Average US residential electricity prices rose about 5% year‑on‑year in 2025, reaching a record 17.3 cents per kilowatt‑hour, with increases of 30% or more since 2020 in at least 11 states.
In parts of eastern Pennsylvania, power prices have surged roughly 200% over that period, adding on the order of 23 dollars per month to the average household bill this year alone.
PJM, the country’s largest grid operator, expects data centers alone to add around 23 billion dollars to customer bills over the three years ending May 2028, as summer power demand climbs by roughly 224 gigawatts—enough to power about 180 million homes—driven by server farms, EVs, and heat pumps.
Airlines, unlike indexes, cannot hedge reality with narratives.
Alaska Air just suspended financial guidance, citing jet fuel costs that are now closing in on 200 dollars a barrel in its world.
That is not a line on a chart; it is cash leaving a P&L because molecules are scarce.
We are not seeing that level of stress reflected in a gradual, sober repricing of energy risk across the curve; we are seeing it reflected in emergency management decisions by firms that actually have to buy fuel.
Food is next.
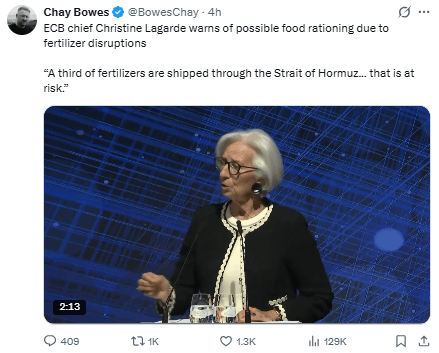
The head of the European Central Bank is now warning in public about possible food rationing because a third of global fertilizer shipments pass through the Strait of Hormuz and are “at risk.”
Central bankers spent a decade telling us inflation was “transitory.”
They did not spend that decade talking about ration books.
When they start doing that now, it is not because the models suddenly became more dramatic; it is because they are finally being forced to acknowledge where physical constraints are showing up.
In all three cases—power bills, jet fuel, fertilizer—price discovery has migrated out of the benchmark and into the bill.
The screen is still trading a soft‑landing story; the invoices are already settling a different one.
3. Silver: six deficits and a record import binge
Now look at silver, where the disconnect is even clearer.
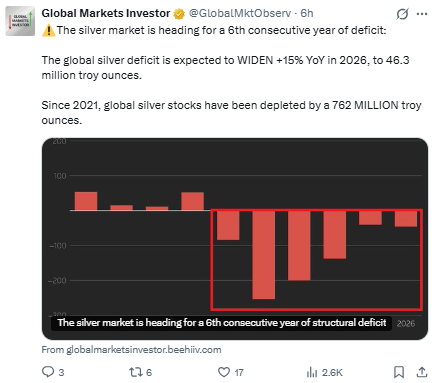
The market is heading into its sixth consecutive year of deficit, with 2026’s shortfall expected to widen another roughly 15% year‑on‑year to about 46.3 million ounces.
Since 2021, global silver stocks have been drawn down by an estimated 762 million ounces.
That is not a rounding error; it is the equivalent of draining years of mine supply out of inventories in less than half a decade.
Who is doing the buying?
In March, China imported more silver than in any March on record, with the 2026 line effectively going vertical versus every prior year on the chart.
The caption makes the drivers explicit: investment and industrial demand are both rising even as supply is threatened by shortages of diesel and sulfuric acid, the basic inputs needed to dig and process ore.
When the country that dominates solar manufacturing, electronics assembly, and battery production steps in to grab as much silver as it can, it is not because the meme on social media turned bullish; it is because factories and utilities are staring at their own order books and supply chains.
Technically, the metal is not behaving like a tired range trade either.

One of the cleaner technicians in this space notes that silver broke out of a 12‑year base in the summer of 2025, and describes the move as “the arrow has left the bow,” with no turning back until the underlying global economic and debt issues are addressed.
We do not have to agree with every word of that to notice the pattern: physically, structurally, behaviorally, silver is already being treated as scarce.
The one place that has not fully repriced that scarcity is the generic price on our screens.
Price discovery in silver has migrated to deficits, imports, and industrial procurement.
The longer the futures curve refuses to acknowledge that, the sharper the eventual catch‑up will have to be.
4. Gold: where solvency is quietly being repriced
If silver is the industrial canary, gold is the solvency ledger.
The US Treasury owns 261,498,926 fine troy ounces of gold, carried on its books at a statutory price of 42.2222 dollars per ounce.
Spot gold just closed near 4,809 dollars.
The gap between those two numbers is roughly 1.25 trillion dollars of unrecognized mark‑to‑market sitting on the sovereign balance sheet, invisible to every fiscal model that still plugs in the statutory price.
Every 100‑dollar rise in gold adds about 26.15 billion dollars to that hidden equity.
Now zoom out to the system level.
Central banks collectively hold on the order of 38,000 tonnes of gold, worth around 5.9 trillion dollars at current prices, which now exceeds the 4.04 trillion in foreign official US Treasury holdings reported in the February 2026 TIC data.
This is not a marginal hedge; it is a regime change.
The 2022 Russia reserve freeze was the pivot.
Before it, IMF gold reporting compliance was broad.
After it, estimates from the World Gold Council suggest that aggregate central‑bank buying has exceeded visible IMF flows by more than a factor of two since 2021, implying large, quiet accumulation.
Behaviorally, the 2025 World Gold Council survey of reserve managers looks less like a “survey” and more like a referendum.
Ninety‑five percent expect global central‑bank gold reserves to rise; roughly forty‑plus percent expect their own institution to add; exactly zero percent expect their institution to sell.
Zero.
That is not a distribution of opinions.
It is a consensus that no individual player has any incentive to break.
The reserve issuer that everyone still models off the dollar is also the largest single holder of the competing reserve asset.
Each incremental move in gold quietly repairs its own balance sheet while eroding the informational content of the Treasury curve.
The benchmark has moved.
It is just doing so in a place our usual valuation tools refuse to look.
Access the Signal Behind the Distortion
Debt-fueled distortions are warping stocks, credit, and global liquidity. We track the structural signals building beneath the surface — gold, silver, and the asymmetric setups mainstream coverage overlooks.
Already a paying subscriber? Sign In.
Reply