- The Sovereign Signal
- Posts
- Japan and Asian Markets In Free Fall As Reverse Carry Trade 2.0 Starts, Water Desalination Strikes Mark MAJOR Escalation🚨, Silver Price Resilient ~60% Above Its Prior All-Time Highs Amidst Global Margin Calls
Japan and Asian Markets In Free Fall As Reverse Carry Trade 2.0 Starts, Water Desalination Strikes Mark MAJOR Escalation🚨, Silver Price Resilient ~60% Above Its Prior All-Time Highs Amidst Global Margin Calls
Luke Lovett
March 09, 2026
The world’s most important funding node just got hit by an energy shock.
Japan matters because it has spent decades as a quiet source of cheap funding for global speculation.
Borrow cheap yen, buy foreign assets, lever the spread, repeat.
That works when oil is tame, rates are stable, and liquidity is abundant.
It works a lot less well when oil rips and Japan — which gets about 95% of its oil from the Middle East, with roughly 70% transiting Hormuz — suddenly faces an import shock.
…the market is asking:
What happens when the fuel bill rises for one of the world’s key leverage transmitters?
Not just:
oil up
stocks down
But:
oil up → Japan squeezed → yen dynamics destabilize → carry trades wobble → forced selling shows up in “unrelated” assets
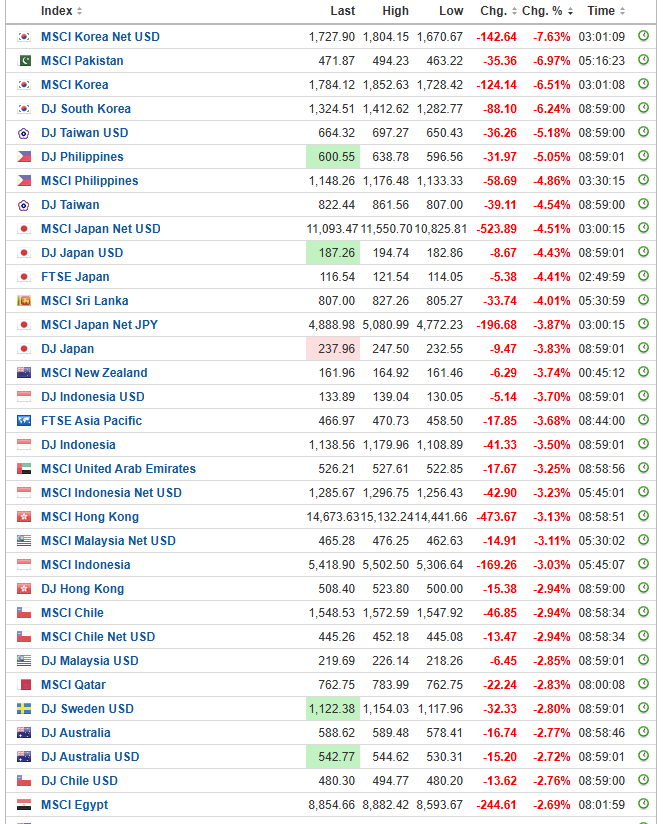
Why Asia is selling off so violently
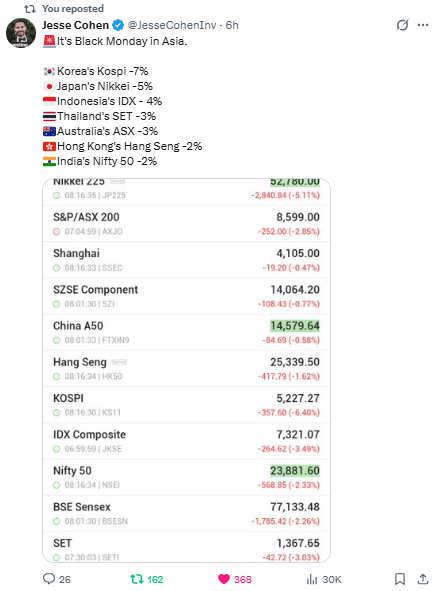
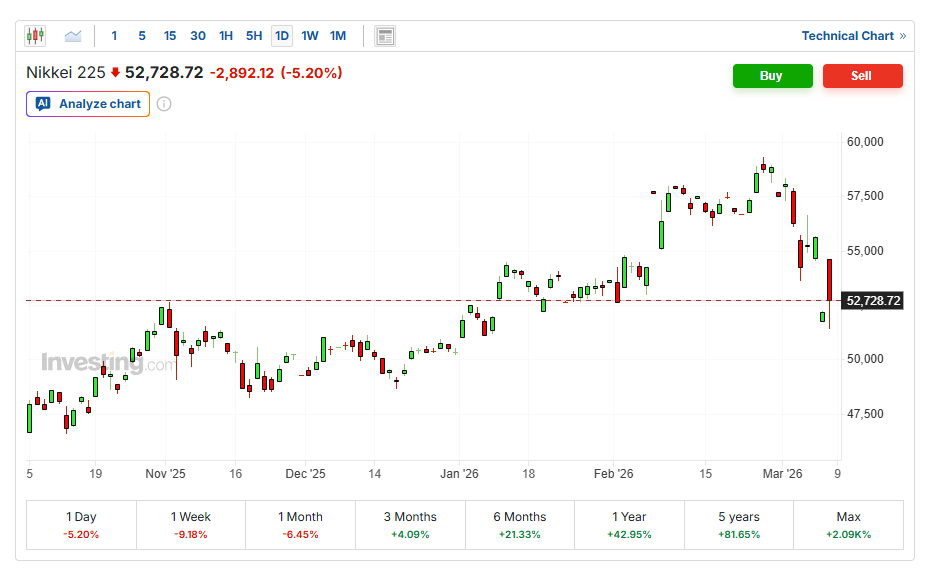
The Nikkei was down about 6% on the day, and Reuters described the broader Asia selloff as severe enough that South Korea’s KOSPI suffered its worst day ever earlier in the week, down about 12%, with circuit breakers triggered.
That’s not just “fear.”
That’s what happens when markets realize several things at once:
energy costs are going higher,
bond yields are not falling to cushion the blow,
and a heavily levered regional funding system is vulnerable.
The hidden piece is that Asia is not just “reacting to war.”
Asia is reacting to the possibility that its imported-energy model gets repriced in real time.
Reuters notes both Japan and South Korea are especially exposed to Middle Eastern crude.
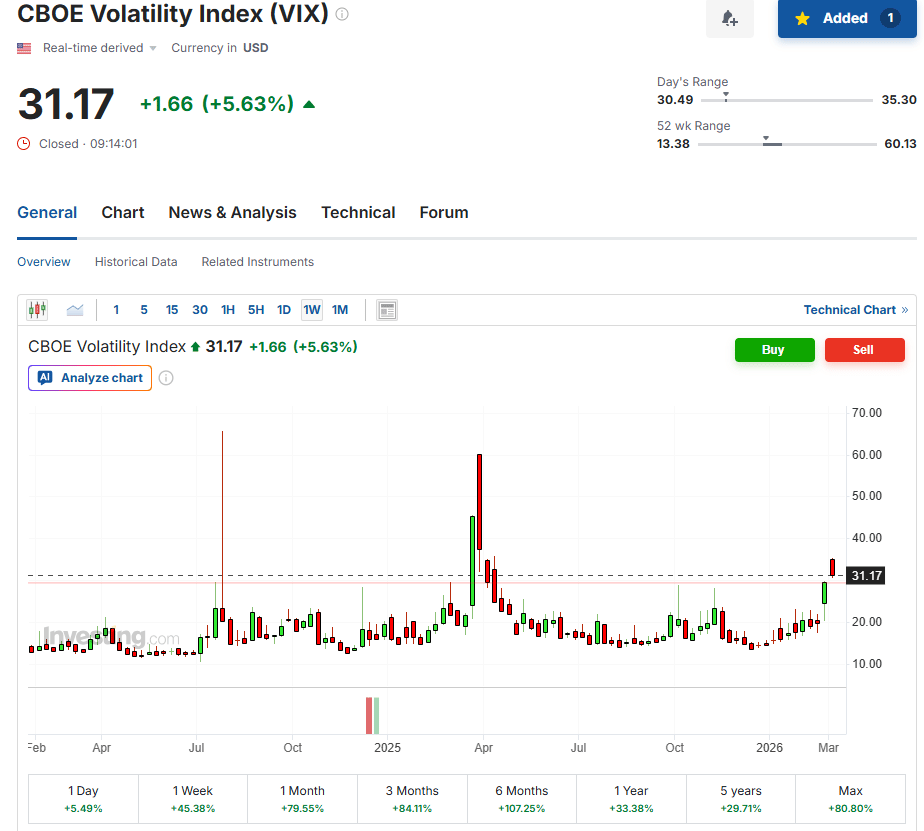
VIX at 30 is the psychological threshold where the market stops pretending everything is fine
Historically:
VIX < 15 → complacency
15–20 → normal risk pricing
20–30 → stress building
30+ → institutions start hedging aggressively
Once the VIX sits above 30, option dealers and systematic funds begin changing behavior.
The real mechanism: volatility forces deleveraging
Modern markets are full of strategies that scale exposure based on volatility:
• volatility targeting funds
• risk parity portfolios
• CTA trend funds
• option dealer gamma hedging
• portfolio insurance strategies
When volatility rises, these strategies must reduce exposure.
Not because they are bearish.
Because their risk models force them to.
That’s why volatility spikes often accelerate themselves.
Volatility → forced selling → more volatility → more forced selling.
Now layer in the macro backdrop
Look at the sequence forming:
1️⃣ Oil spike (Middle East shock)
2️⃣ Japan equities collapsing
3️⃣ Yen carry trade stress
4️⃣ Asia markets cascading lower
5️⃣ VIX breaking above 30
This is exactly how stress propagates in a hyper-levered global system.
It rarely begins with the S&P collapsing.
It begins with funding nodes destabilizing.
Japan is one of the biggest.
Why the VIX chart is particularly important
Look at the structure.
For almost two years the VIX has been compressed between ~12–20.
That compression tells you something critical:
The market has been selling volatility aggressively.
In other words:
People were short insurance.
When volatility begins expanding after long compression, the unwind can be violent.
The classic sequence looks like this:
compression → break above 20 → acceleration to 30 → reflexive spike toward 40–50
Not guaranteed.
But historically very common.
The VVIX clue (this is the deeper layer)
In the last report we noted something very important:
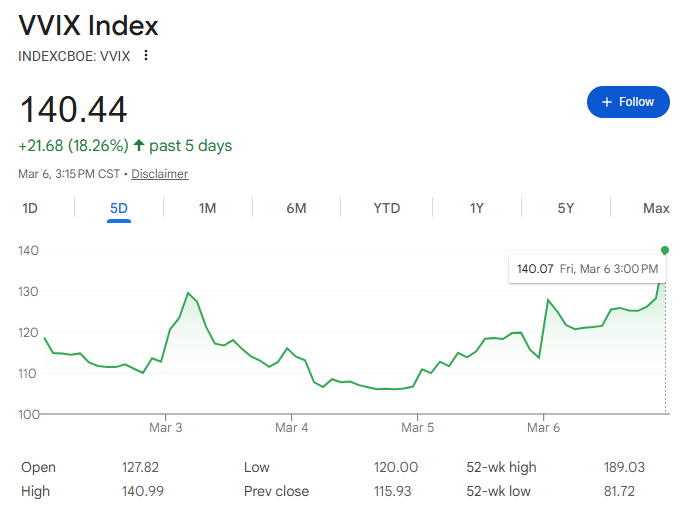
VVIX exploded much faster than VIX.
That means traders are not just hedging stocks.
They are hedging volatility itself.
That is second-order fear.
The market is saying:
“I’m not sure what happens next, but I’m afraid volatility could become disorderly.”
That’s the moment when liquidity starts thinning.
Why this matters for the bigger picture
We need to look at all this through the lens of the largest debt super-cycle in history.
The entire modern financial system relies on three pillars:
cheap energy
low interest rates
abundant liquidity
Right now all three are under pressure simultaneously.
Oil shock → inflation risk
Bond yields → remain elevated
Funding flows → destabilizing
That combination is rare.
It’s why people keep referencing 1973 (energy shock) + 2008 (leverage unwind).
The most important thing to watch now
Not the stock market.
Watch the funding layer.
Specifically:
• USD/JPY
• Japanese government bond yields
• credit spreads
• Treasury liquidity
• VVIX
If the yen suddenly strengthens violently (think below 152), that would signal the carry trade unwinding fast.
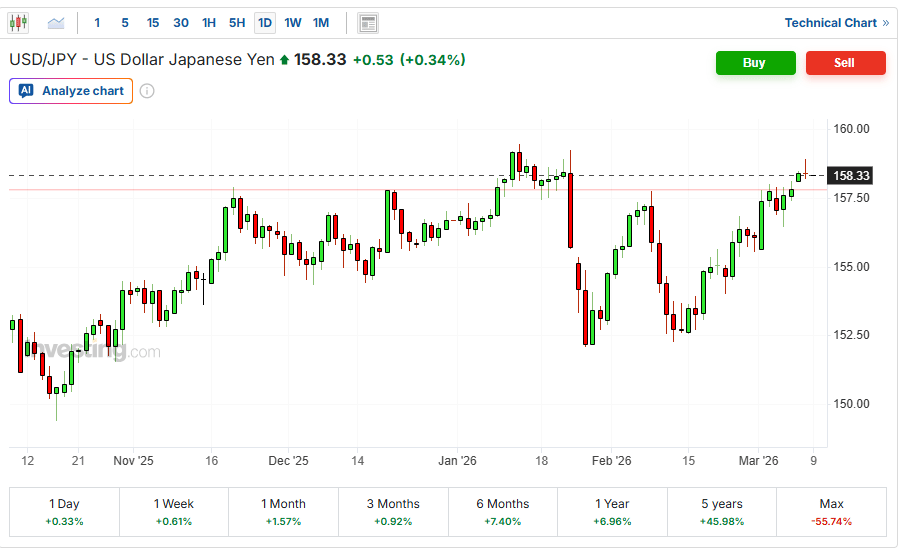
That’s when global asset selling tends to accelerate.
Access the Signal Behind the Distortion
Debt-fueled distortions are warping stocks, credit, and global liquidity. We track the structural signals building beneath the surface — gold, silver, and the asymmetric setups mainstream coverage overlooks.
Already a paying subscriber? Sign In.
Reply