- The Sovereign Signal
- Posts
- Silver’s 40-Year Breakout: When Ancient Collateral Meets a Cracking Debt Layer
Silver’s 40-Year Breakout: When Ancient Collateral Meets a Cracking Debt Layer
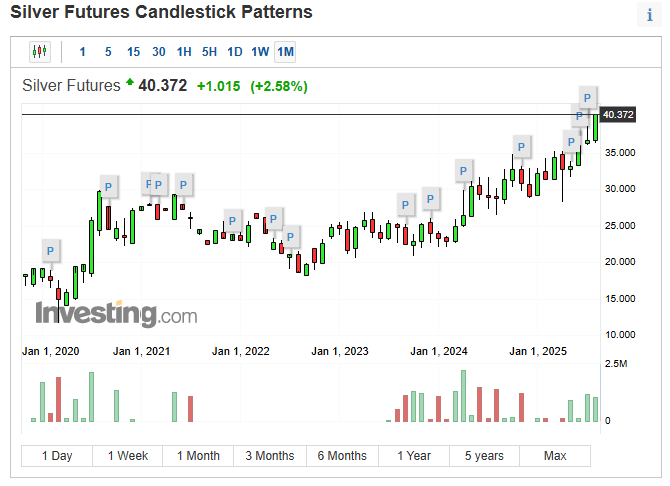
From $17.905 in 2020 to $40.372 today—yet still ~18.4% below its all time high from over 45 years ago. A once-in-a-generation asymmetry: three mega bullish patterns, structural deficits, and the slow motion collapse of debt-based collateral pointing to gold and silver’s re-rating as the true base layer.
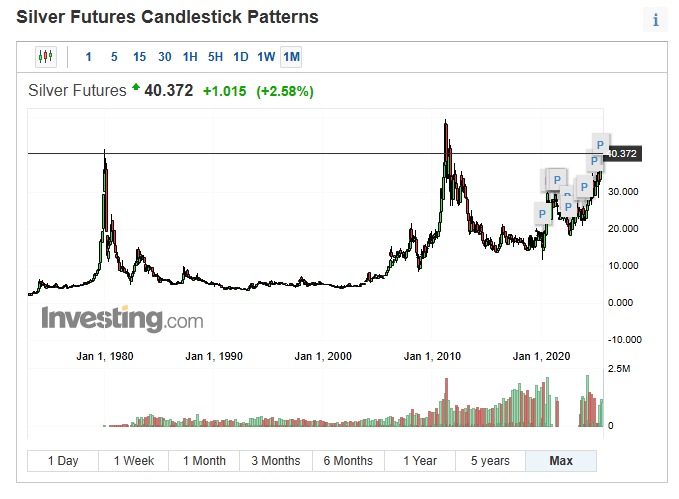
Silver just closed at $40.372—up ~125.5% from $17.91 at the start of 2020—yet it still sits ~18.4% below its all-time high from 1980.

Think about that: four and a half years of powerful gains… and we haven’t even revisited a 45-year-old print.
Why that asymmetry is extraordinary:
The base layer mismatch: Debt and financial claims exploded for decades; the most intrinsically valuable assets didn’t.
When the financial tide recedes, capital seeks collateral that doesn’t depend on anyone’s balance sheet. That’s silver.
Price action that says “structural,” not “squeeze”: SLV borrow has cooled (~0.47%, ~4M shares available).
Translation: current strength isn’t a fleeting borrow crunch; it’s a bid for the metal itself.
If borrow tightens later, that’s jet fuel—not the engine.
The supply math refuses to blink: Industrial demand (solar, electronics, grid) keeps compounding while mined supply (mostly by-product) can’t “flip a switch.”
Deficits don’t yell; they persist—until they reprice.
Plumbing tells the same story: Markets are living “paycheck-to-paycheck” on overnight funding, while willingness to warehouse long bonds keeps fraying.
When the street avoids balance-sheet risk, the timeless hedge gets marked up.
The setup in one sentence:
A spring coiled by decades of monetary expansion with no equivalent re-rating in a 5,000-year base asset.
It’s increased by ~125.5% since 2020—without taking out the 1980 high.
What happens if we simply tag the old high… and then the market starts to actually price in the exponentially increasing structural fragility in the global economy?
How to think about it:
Treat $40 as confirmation, not culmination.
Expect air pockets—that’s the nature of repricing—but recognize the drift is higher as fundamentals (industrial + monetary) converge.
Own convexity: a core position you don’t rent nightly and a plan to add on forced dips.
The punchline:
Essentially every asset class’s increasingly distorted valuation relies on artificially cheap debt and increasingly sophisticated liquidity backstops.
Silver is a pressure release valve for decades of distortions.
Signal | Latest Level | Interpretation | Zone |
|---|---|---|---|
10-Year Swap Spread | –25.28 bps | Still deeply negative, but a slight easing from prior levels. Confirms ongoing impairment in cash Treasuries: dealers still prefer swaps (synthetic exposure) over warehousing real bonds. | 🔴 Red |
Reverse Repos (RRP) | $77.898B | A jump from prior days, but still under the $100B “stress line.” Cushion is thin, meaning Treasuries continue to circulate “in the wild” with higher collateral velocity. | 🔴 Red |
USD/JPY | 147.05 | Danger band intact; volatility tripwires remain critical at 140/160. Carry trade fragility persists. | 🟠 Orange |
USD/CHF | 0.8006 | CHF safe-haven bid remains strong — ongoing hedging flows against systemic fragility. | 🟠 Orange |
3-Year SOFR–OIS Spread | 29.4 bps | Back up toward highs — term funding stress intensifying. Lenders continue charging a steep “future anxiety premium.” | 🔴 Red |
SOFR Overnight Rate | 4.34% | Slight dip from recent highs but still sticky. Confirms elevated funding costs even as repo pipes remain stuffed. | 🟡 Yellow |
SOFR Daily Volume | $2.87T | Still redlining. Market is chained to record nightly rollovers — paycheck-to-paycheck liquidity dependence. | 🟠 Orange |
SLV Borrow Rate | 0.47% (4M avail.) | Costs cooled slightly, availability steady. Temporary relief, but system still fragile. | 🟡 Yellow |
COMEX Silver Registered | 199.96M oz | Stocks trending upward — some short-term cushion returning. But still razor-thin against paper leverage. | 🟠 Orange |
COMEX Silver Volume | 74,699 | Moderate activity — lighter than peaks, suggesting digestion of recent moves. | 🟡 Yellow |
COMEX Silver Open Interest | 154,342 | Down slightly — leverage trimmed but still elevated. | 🟠 Orange |
COMEX Gold Registered | 21.43M oz | Flat. Remains wafer-thin compared to exposure on paper markets. | 🟡 Yellow |
COMEX Gold Volume | 207,110 | Strong turnover — positioning rotation alive and well. | 🟠 Orange |
COMEX Gold Open Interest | 478,014 | New highs again — conviction exposure still growing. | 🟠 Orange |
UST–JGB 10Y Spread | 2.623% | Holding mid-zone. Below 2.5% → carry fragility, above 3% → weaker UST demand. Stuck in the danger band. | 🟠 Orange |
Japan 30Y Yield | 3.177% | Still near all-time highs. Pressure continues to export into global bond markets. | 🔴 Red |
US 30Y Yield | 4.918% | Pressing cycle highs. Debt fragility at the global base layer remains severe. | 🟠 Orange |
Unparalleled Asymmetry

Multi-Decade Cup-and-Handle (Superstructure)
Cup: The enormous rounded base spanning 1980 → 2011 → 2020s. After the 1980 Hunt Brothers spike and subsequent collapse, silver spent decades grinding sideways and gradually rounding higher. That’s a textbook “cup.”
Handle: The 2011–2020 choppy downtrend created the handle—10 years of consolidation that bled off froth and set the stage for a breakout.
Why it matters: Cup-and-handle patterns on long-term charts signal a breakout of historic magnitude.
Given the duration of this one (40+ years), the upside projection is equally historic: it argues for new all-time highs with force, not a gentle drift.
The Ascending Triangle (2011 Highs → Now)
Silver’s been capped around $49 since 1980, but look closer: each successive low (2015, 2020, 2022) has been higher than the last.
That’s a giant ascending triangle pressing against the $49.45 “ceiling.”
Why it matters: Ascending triangles show demand overpowering supply. Sellers cap the highs, but buyers keep stepping up earlier.
Pressure builds until the ceiling cracks.
Once it does, the move often mirrors the height of the triangle (here, easily +$40, pointing toward ~$90 and beyond).
Inverse Head and Shoulders (2011–2022)
Left Shoulder: The 2015 low (~$13.65).
Head: The March 2020 COVID crash (~$11.64).
Right Shoulder: The 2022 pullback (~$18).
The neckline runs across ~$28–30 (which silver has since cleared and retested).
Why it matters: Inverse H&S patterns are some of the most reliable bottoming structures.
This one spans an entire decade. The measured move from the neckline suggests a target easily in the $50–60s just for the first leg.
Break Above the 40-Year Midline
Silver has decisively closed above $40 (now $40.372).
Closing above $40 validates that the long consolidation is over. It’s a psychological and technical “line in the sand.”
The Macro Overlay
Price Context: Silver has surged +125% since 2020 ($17.905 → $40.372).
Yet: It still sits ~18% below its 1980 high—which means adjusted for inflation, silver is still dirt cheap.
Signals backdrop: 10 Year Swap Spread deeply negative (Treasury liquidity stressed), reverse repos drained, overnight funding volume making new all time highs every few months → fragile collateral base.
Silver as “ancient collateral” is where capital flees when synthetic leverage creaks.
Why This Setup Is Compellingly Bullish
This isn’t just a single bullish pattern.
It’s three superimposed: cup-and-handle, ascending triangle, and inverse head-and-shoulders—all overlapping on a multi-decade horizon.
Breakouts from this scale of structure are rare and explosive.
Combine the technicals with the fundamentals (structural deficit ~180M oz/year, potential “critical mineral” designation, central banks buying more gold than Treasuries), and silver is positioned not just for a breakout, but for a repricing of its role as base-layer collateral.
🔥 Bottom Line:
Silver’s chart is a compressed spring coiled for decades.
Now it’s pressing against the lid (~$49.45) with every macro stressor adding weight.
Once the breakout confirms, it won’t just be another rally—it will be the kind of move that rewrites the financial narrative of a generation.
Why I Use HardAssets Alliance
HardAssets Alliance provides:
100% insurance of metals for market value
Institutional-grade daily audits and security
Best pricing — live bids from global wholesalers
Fully allocated metal — in your name, your bars
Delivery anytime or vault-secured across 5 global hubs
Luke Lovett
Cell: 704.497.7324
Undervalued Assets | Sovereign Signal
Email: [email protected]
Disclaimer:
This content is for educational purposes only—not financial, legal, tax, or investment advice. I’m not a licensed advisor, and nothing herein should be relied upon to make investment decisions. Markets change fast. While accuracy is the goal, no guarantees are made. Past performance ≠ future results. Some insights paraphrase third-party experts for commentary—without endorsement or affiliation. Always do your own research and consult a licensed professional before investing. I do not sell metals, process transactions, or hold funds. All orders go directly through licensed dealers.
Reply