- The Sovereign Signal
- Posts
- 🥈 Silver: The Ancient Future of Money
🥈 Silver: The Ancient Future of Money
As Large Specs Pile Into Futures (+4,243 longs) and Spreads Spike 41%, SLV Borrow Rates Rip 0.68%⬆️2.54% with available shares to borrow 4.1M⬇️100K — COMEX Data Shows a Market Closer to a Structural Breaking Point
Luke Lovett
July 21, 2025
It’s only fitting that as five decades of monetary distortion starts to unwind, the first metal ever used as currency in ancient Mesopotamia is finally stepping back into the spotlight.
The Spanish silver dollar was the first true international reserve currency.
Silver was also the primary unit of currency to link Eastern and Western commerce for the first time on the Silk Road.
For thousands of years, silver was money itself—not a hedge, not an ETF, not a line item— the most practical form of universal barter and exchange.
For the last 54 years, we’ve forgotten that.
Silver has been treated like a commodity—useful, yes, but not central.
And yet look at this chart.
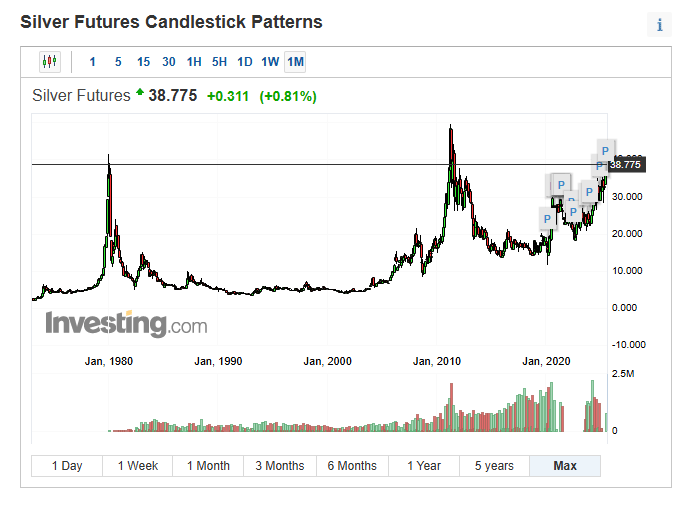
👉 Four and a half decades later, silver still trades well below its 1980 all‑time high ($49.95 on January 17, 1980).
It’s mind‑bending when you realize that since then:
📌 The world’s money supply has exploded many times over.
For context: U.S. M2 money supply stood at just $1,482.7 billion in 1980.
Today it’s roughly $21,942 billion.
👉 That’s a more than 14‑fold increase in the base money sloshing through the system… while silver, the very first metal used as a currency, is still trading below its 1980 high.
That contrast isn’t just striking — it’s a flashing signal that silver remains massively undervalued relative to the monetary expansion of the last four and a half decades.
📌 The derivatives market has ballooned into the quadrillions.
Estimates put the notional value of global derivatives at $1–2 quadrillion, dwarfing the size of the world’s stock markets.
👉 That mountain of contracts is ultimately built on confidence in collateral… yet silver, a foundational monetary asset for millennia, remains sidelined and trading far below its 1980 peak.
That disconnect isn’t just remarkable — it highlights how fragile today’s leveraged system really is.
📌 Asset prices have been inflated by decades of cheap debt.
Since the end of the gold standard in 1971, every single recession has been prematurely ended by slashing rates — meaning we haven’t had a truly organic business cycle since we untethered our money supply from intrinsic value.
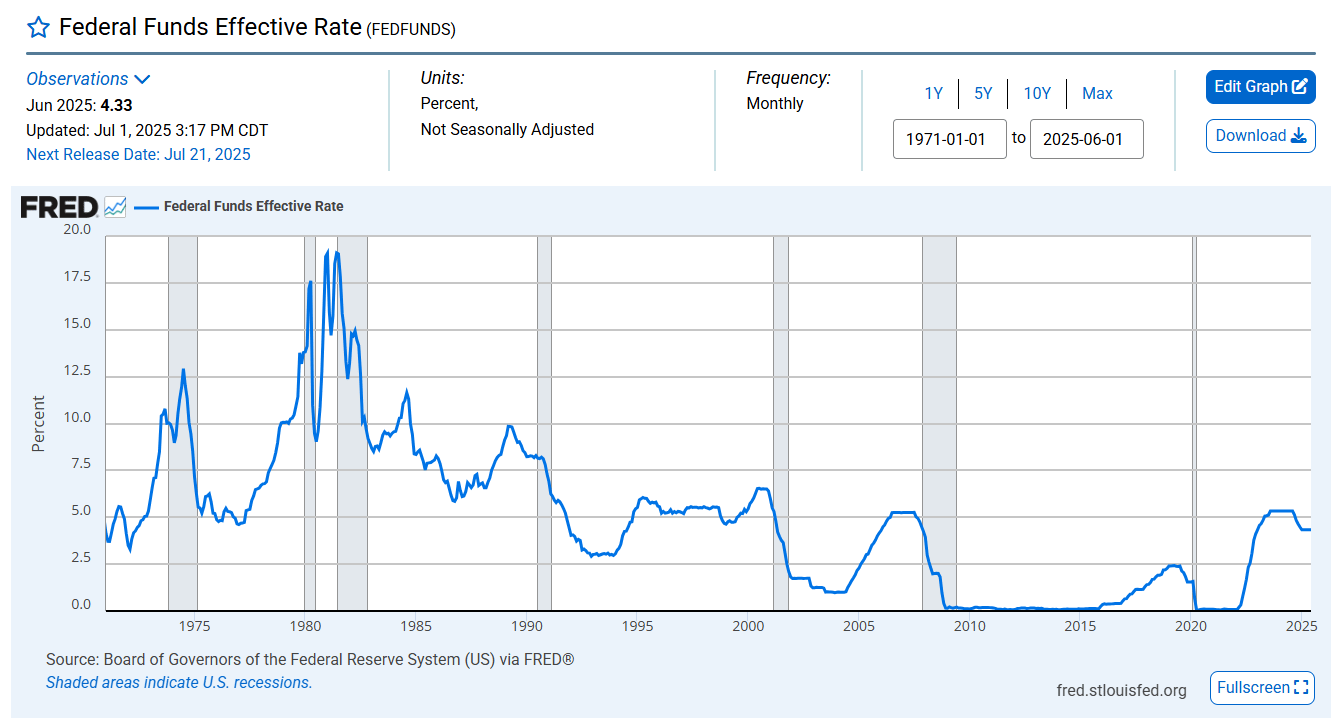
⬆️Rates chart since 1971 - gray bars = recessionary period⬆️
👉 The past 54 years leaned heavily on lower and lower rates to minimize economic pain… what happens when that lever starts to malfunction?
We already saw a preview: from September through December last year the Fed cut 100 bps, yet the 10‑year yield — the rate that actually drives borrowing costs and growth — is now ~50 bps higher than it was when cuts began.
It’s taking more and more debt to drive less and less growth.
In 1971, when the U.S. left the gold standard, it took about $1.50 of total debt to produce $1 of GDP.
Today, it takes over $3.50 of debt to produce that same $1 of GDP.
Yet silver — still trades far below its 1980 high.
That contrast isn’t just ironic — it’s a flashing signal of where real, intrinsic value will massively reassert itself.
Signal | Latest Level | What It Means | Zone |
|---|---|---|---|
10‑Year Swap Spread | –28.71 bps | Still deeply negative → market preferring synthetic exposure (derivatives) over cash Treasuries → a sign of collateral distrust. | 🔴 Red |
Reverse Repos (RRP) | $199.298 B | Watch out for a sustained break below $100 Billion. | 🟠 Orange |
USD/JPY | 147.79 | Yen under pressure as BoJ prioritizes defending bonds → carry trade stretched further. | 🟠 Orange |
USD/CHF | 0.7999 | Back under .8, Swiss franc bid despite low yields → ongoing rotation into alternate safe havens. | 🔴 Red |
3‑Year SOFR‑OIS Spread | 24 bps | Elevated → forward funding stress remains present. | 🟠 Orange |
SOFR Overnight Rate | 4.34 % | Headline stable, but underlying repo dynamics show strain in collateral circulation. | 🟢 Green |
SLV Borrow Rate (CTB) | 2.54 % | 🔥 Borrow squeeze action has eased slightly but remains very elevated (0.68 % w/ 4.1M shares on Jul 10 → 1.82 % w/ 0 shares → now 2.54 % w/ 100,000 shares available). Shorts still under heavy pressure. | 🔴 Red |
COMEX Silver Registered | 195,913,275.19 oz | Registered ounces still far below open interest → <25 % standing for delivery would drain inventory. | 🔴 Red |
COMEX Silver Open Interest | 171,729 contracts | ≈ 858.6 M paper ounces vs ≈ 195.9 M registered → thin physical cover. | 🔴 Red |
COMEX Silver Total Volume (Jul 18) | 44,959 | Active churn in a market with tight borrow. | 🟠 Orange |
GLD Borrow Rate | 0.49 % | Stabilized, far calmer than silver. 4.1M shares available. | 🟢 Green |
COMEX Gold Registered | 20,190,185.97 oz | Registered gold steady despite rising OI → slow underlying tightening. | 🟡 Yellow |
COMEX Gold Open Interest | 454,005 contracts | ≈ 45.4 M paper oz vs ≈ 20.19 M registered → ~45 % standing for delivery would drain inventory. | 🟡 Yellow |
COMEX Gold Total Volume (Jul 18) | 134,215 | Elevated turnover alongside rising open interest. | 🟡 Yellow |
10Y UST–JGB Spread | 2.859 % | Spread still wide → US/Japan yield correlation highlighting systemic stress. | 🟠 Orange |
Japan 30‑Year Yield | 3.069 % | Near record highs → BoJ forced to defend bonds, adding fragility. | 🔴 Red |
US 30‑Year Yield | 4.951 % | Rising in tandem with JGBs → bedrock collateral wobbling. | 🟠 Orange |
SOFRVOL (Repo Usage) | $2.743 T | Overnight funding usage remains cyclically high → system leaning harder on short‑term liquidity. | 🟠 Orange |
🏦 Why the COMEX (and SLV) Matter
This is why what’s happening on the COMEX isn’t just a niche trader’s obsession—it’s a signal.
There is likely far more aggressive suppression on the LBMA that we can’t see, but the COMEX is transparent enough to reveal the pressure building:
Commercials still hold near-record net shorts.
SLV, the world’s largest silver ETF, has become the go‑to pool for shorts desperate to locate physical—and that’s why watching the SLV borrow rate is crucial.
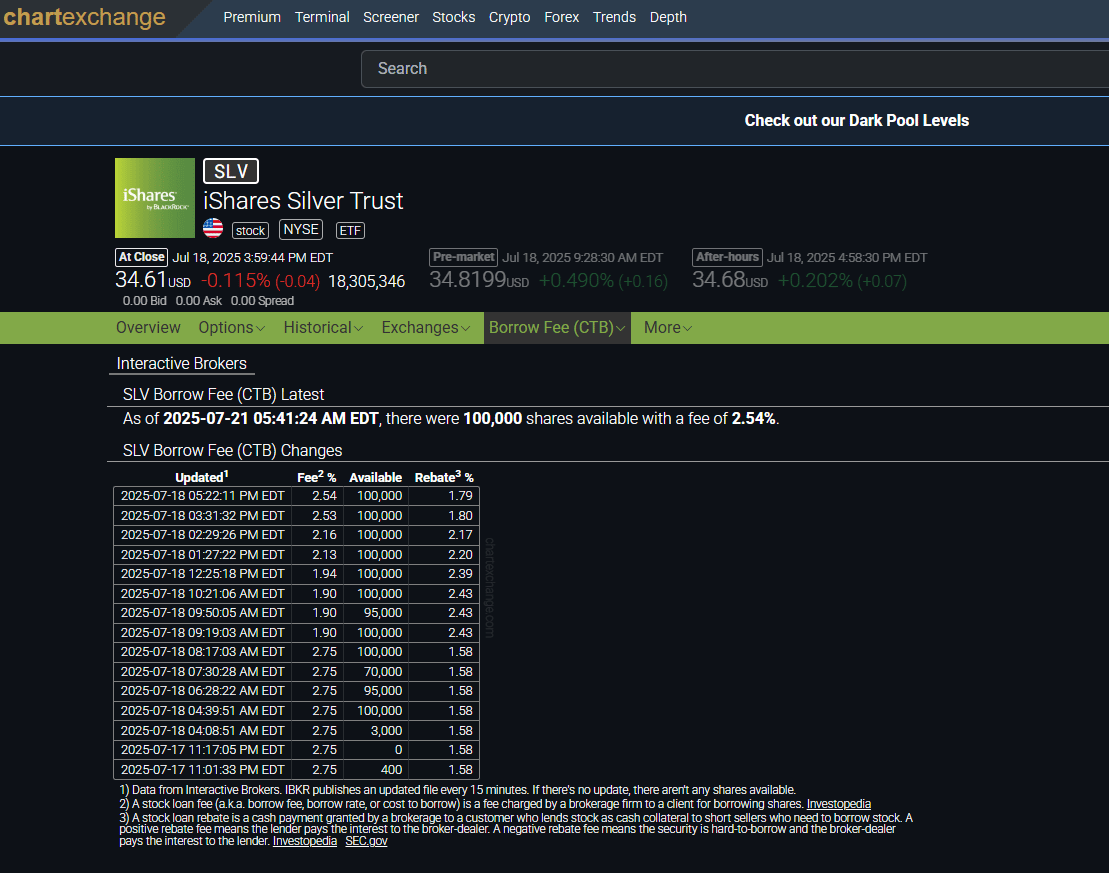
💥 SLV Borrow Market Screams Stress
On July 10th, we saw:
✅ SLV borrow fee: 0.68%
✅ Shares available: ≈4.1M
By end of last week:
🚨 SLV borrow fee: 2.54%
🚨 Shares available: ≈100k
That’s an almost four-fold increase in borrow cost and a dramatic collapse in borrowable inventory — classic symptoms of a short market under strain.
⚡ Silver: A Historic Inflection Beneath the Surface
As of 6:30 AM ET, silver trades at $38.883, holding the breakout above $38 — a level we haven’t seen in 13 years.
For very short-term context, we entered last week at $39.13 and closed at $38.464.
While price consolidated, the underlying positioning and market structure tell a far more explosive story.
🔍 Who’s Really Fighting Whom on the COMEX?
When you look at the COT reports for silver, one thing jumps out immediately:
Futures absolutely dominate the positioning.
Options activity is a rounding error compared to the sheer size of futures contracts.
👉 Implication: these are not retail day‑traders buying a handful of calls.
Futures are the arena of institutions, funds, and professional desks that need deep liquidity and massive leverage — whether to hedge physical flow, express macro trades, or attempt to control price.
Options traders often lean directional with defined risk.
Futures traders?
They’re the ones slamming size, rolling positions, and pressing shorts because futures give direct exposure and deep liquidity.
That’s why the battlefield that matters is futures — not the relatively tiny options book.
📊 Futures Positioning (July 11 → July 18)
Large Speculators (macro funds, CTAs, trend‑followers):
✅ Longs surged from 80,779 to 85,022 (+4,243)
✅ Shorts rose from 22,258 to 25,574 (+3,316)
➡️ They’re not backing off — they’re adding gross exposure on both sides, a sign of aggressive positioning into a squeeze.
These are the players trying to ride momentum, chase breakouts, or arbitrage spreads.
Think hedge funds, commodity pools, and high‑speed desks hunting volatility.
Commercials (bullion banks and dealers):
🔻 Longs slipped from 37,094 to 35,466 (–1,628)
🔻 Shorts slipped from 116,689 to 115,114 (–1,575)
➡️ But even with trimming, they’re still net short ~80k contracts — roughly 246M ounces.
These are the big houses: market makers, bullion banks, and swap dealers who have historically capped rallies by supplying paper silver… until the physical market tightens and their hedges start to bleed.
Open Interest:
Ticked from 162,803 to 171,474 as spreads churned — evidence of heavy two‑way activity rather than calm positioning.
📊 Futures & Options: A Surge In Spreading Positions
One of the most telling shifts between July 11 and July 18 wasn’t just in directional longs and shorts —it was in spreading positions.
👉 Large speculators’ spreading positions (futures + options combined) jumped by 10,968 to 43,199.
👉 On the futures side alone, spreading positions exploded 41% or 5,399 to 18,565.
What does that mean?
Spreads are not “I think silver goes up or down.”
They’re inter‑market or intra‑market trades — long one contract, short another — to exploit curve structure, delivery dynamics, or basis differentials.
These are often used by more sophisticated players:
Commodity trading advisors (CTAs) and hedge funds running relative value strategies,
Large funds front‑running roll activity,
Or desks positioning for delivery tightness between nearby and deferred months.
A spike like this means professional money is suddenly far more active in the microstructure of the silver curve.
It suggests they see something structural developing in the front months versus out months — often a tell of physical tightness creeping in.
⚡ The Cracks in the Foundation Are Showing — and Silver Is the Pressure Valve
Step back and look at the landscape we’ve just walked through:
📌 A global financial system built on layers of leverage, with derivatives dwarfing the size of the stock market, all predicated on one assumption: that liquidity will always be there.
📌 A base layer of sovereign debt — U.S. Treasuries and JGBs — now wobbling under the weight of record deficits, rising yields, and a narrowing buyer base.
Japan has been able to lean on U.S. Treasuries to stabilize its own market… but what do we anchor to when our own base layer starts to strain?
📌 A money supply that has multiplied more than 14× since silver last touched its all‑time high, and yet silver — the first currency humanity ever trusted — still trades far below that peak.
📌 A COMEX battlefield where futures dominate — not casual option punts, but deep-pocketed funds, CTAs, and bullion banks fighting tooth and nail in an increasingly constrained arena.
A surge in spreading positions shows professionals positioning aggressively in the curve, sniffing out structural tightness between delivery months.
📌 An SLV borrow market that’s screaming:
➡️ From 0.68% with 4.1 M shares available on July 10
➡️ To 2.54% with just 100k shares available by last week’s close.
That’s not normal churn. That’s stress under the surface.
All of this points to one thing:
We’re watching the system quietly groan under decades of distortion.
Silver isn’t just another commodity anymore.
It’s starting to reassert itself as a pressure release valve for a system that has leaned on lower and lower rates, more and more leverage, and ever‑growing layers of derivatives to keep going.
Gold is quietly reclaiming its role as the anchor on central bank balance sheets.
Silver is the most electrically conductive metal known to man and second only to gold in terms of its malleability and ductility. It’s getting ready to rip.
History says that when the base layer wobbles, capital rotates to what cannot be printed.
If you’re reading this, you see what’s happening.
You don’t have to time every tick. You just have to understand the direction of history:
🌟 Gold and silver are where the world’s capital goes when trust in collateral begins to fray.
If you want to position yourself, you can do it smart:
✅ Get fully insured vault storage with 1:1 audited metals — you know exactly what’s yours.
✅ Or take delivery if you want it in hand.
✅ And yes, I can help you with both through my gold and silver referral partnerships — reach out if you want details.
The cracks are there for everyone to see.
The question is whether you’ll move before the rest of the world realizes that the old base layer is coming back. 🥇🥈
Luke Lovett
📲 Cell: 704.497.7324
🌐 Undervalued Assets | Sovereign Signal
📧 Email: [email protected]
🔐 Legal Disclaimer 🔐
The content provided herein is for informational and educational purposes only and should not be construed as financial, investment, legal, or tax advice. I am not a licensed financial advisor, investment professional, or attorney. The views expressed are solely those of the author and are not intended to be relied upon for making investment decisions.
While every effort has been made to ensure the accuracy of the information presented, no guarantee is given that all content is free from error, omission, or misinterpretation. Market data, trends, and conditions are subject to rapid change, and past performance is not indicative of future results.
Some views expressed may reference public insights from respected analysts and commentators. Some third-party content may be paraphrased or summarized for educational purposes only, with attribution, and does not imply endorsement or affiliation. All rights remain with the original creators.
Always conduct your own research and consult with a licensed financial advisor or registered investment professional before making any investment decisions. By reading this publication, you agree not to hold the author liable for any losses or damages resulting from the use of this information.
I am not a metals dealer. All orders are processed directly by a licensed precious metals dealer. I do not hold funds, process transactions, or provide personalized investment advice.
Reply