- The Sovereign Signal
- Posts
- ⚡The Hidden Valve: Silver’s Signal Amid Crumbling Treasuries and JGBs
⚡The Hidden Valve: Silver’s Signal Amid Crumbling Treasuries and JGBs
From SLV’s short‐squeeze stress and a Dow/Silver reversion pointing towards $2,521/oz... to the slow failure of fiat itself—Treasuries and JGBs are straining, and silver is emerging as the pressure‐release valve for decades of distortion.
Luke Lovett
July 26, 2025
Even after Friday’s sharp ‑2.19% selloff, silver refused to break down—closing the week at $38.365, barely under its $38.40 open…
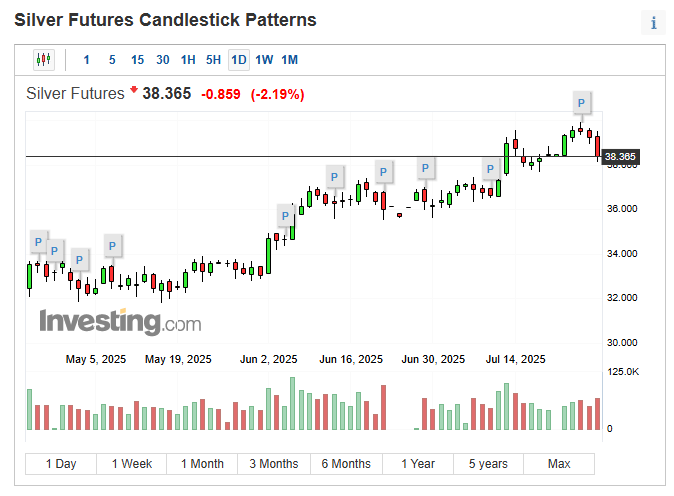
…after ripping as high as $39.908 mid‑week.
That is not the signature of a weak market.
That is the signature of a market straining under the surface—fighting to reprice in real time despite heavy hands leaning on it.
📈 Look at the trend since July 10th
When SLV borrow data first began flashing classic short‑squeeze stress, silver stood at $36.60.
Today?
$38.365 - a confirmed +4.82% gain.
While most were glued to the daily price noise, those of us reading between the lines in the right places saw something very different taking shape —physical supply was clearly showing strain.
💡 The smoking gun
On July 10th, everything in the world’s largest silver ETF — SLV — looked perfectly calm:
🔹 Borrow rate was low (0.68%)
🔹 Plenty of shares available to borrow (4.1 million)
👉 That’s exactly what you expect in a liquid market: abundant supply, minimal cost to borrow.
But within days, the tone flipped into something very different — a market quietly under strain.
July 16th:
Borrow rate jumps to 1.82%… and suddenly no shares are left to borrow.
➡️ Translation: big players looking to short or hedge through SLV could no longer source shares — the cupboard was bare.
July 17th:
Borrow rate spikes again to 2.73%… just 100K shares available to borrow.
➡️ Translation: borrowing demand was overwhelming supply — a telltale sign of stress in a supposedly liquid market.
July 21st:
Borrow rate still elevated at 2.54%… virtually zero inventory available.
➡️ Translation: SLV’s lendable supply was tapped out; there’s real tension behind the scenes.
Why does this matter?
SLV isn’t a niche product.
It’s the largest silver ETF in the world, and its borrow market is where hedge funds, market makers, and institutional traders go when they want to:
✅ Short silver,
✅ Hedge other silver exposures, or
✅ Source temporary synthetic supply to meet obligations.
When that market shows repeated zero‑inventory moments and spiking borrow rates, it’s a powerful signal:
👉 Physical silver supply — or at least the supply institutions can easily tap through ETFs — is showing visible strain.
📈 And despite all this stress, silver’s price didn’t break down.
From $36.60 on July 10th to $38.365 on July 26th, silver actually climbed 4.82%, holding strong even while borrowing costs surged and shares disappeared.
🔎 Read between the lines
These aren’t random blips.
They’re whispers from deep inside the plumbing of the largest silver ETF in the world, hinting that the supply cushion isn’t as comfortable as it looks on the surface.
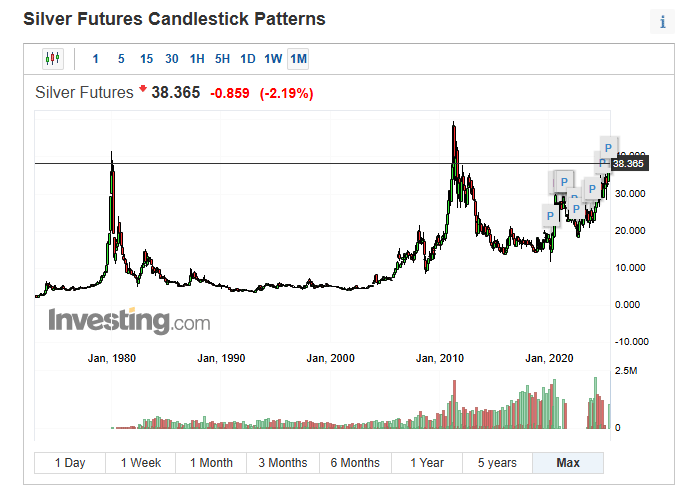
📌 Zoom Out
A fair‑value reversion of the Dow/Silver ratio to historic 1980 levels points toward ≈ $2,521/oz silver (see our full report from June 12th).
That’s not a wild-eyed moonshot guess. It’s grounded in historical precedent.
Reinforced by fundamental ratios that strip out over five decades of debt-fueled distortions.
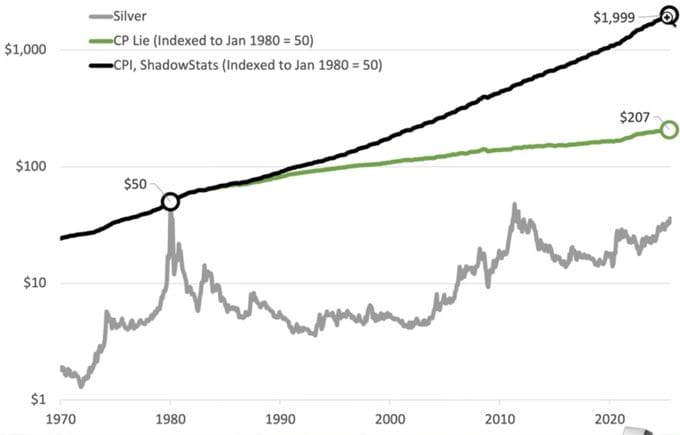
@MakeGoldGreat (on X), @mike_maloney, @GoldSilver_com, and ShadowStats have illustrated how, adjusted for true inflation, silver’s 1980 peak would equate to $1,999/oz today.
It sounds impossible only if you ignore history.
Every prior cycle has mean‑reverted violently, unleashing parabolic moves that feel impossible—until they’re in the rearview mirror.
Bottom line: the market is whispering—loudly—that silver’s undervaluation isn’t just extreme… it’s unsustainable.
We’re going to keep pounding the table on this point:
After five and a half decades of being an abandoned monetary metal, silver is now re-emerging as the pressure‑release valve for a financial system drowning in deeper and deeper debt‑fueled distortions.
COMEX—more transparent than LBMA—is where that pressure shows up first.
And right now?
💥 The clock is ticking.
💥 Those cracks are widening.
Signal | Latest Level | Implications | Zone |
|---|---|---|---|
10‑Year Swap Spread | ‑26.12 bps | Deeply negative for months. Persistent, deep inversion = market prefers synthetic swaps over Treasuries, telegraphing stress in the collateral plumbing. | 🔴 Red |
Reverse Repos (RRP) | $150.509 B | Watch out for a sustained break below $100B like Feb, which preceded global selloffs. | 🟠 Orange |
USD/JPY | 147.67 | Expect BOJ to keep aggressively defending bond yields, can’t cap bond yields and defend currency at the same time. | 🟠 Orange |
USD/CHF | 0.7949 | Swiss franc near all time lows while global reserves recently increased roughly 340. Capital flight to safety. | 🔴 Red |
3‑Year SOFR–OIS Spread | 27.6 bps | Far above the low single‑digit bps typical of a well‑lubricated system. This widened premium = funding stress priced deep into the curve. | 🟠 Orange |
SOFR Overnight | 4.3 % | Front‑end funding steady. No abnormal signal here. | 🟢 Green |
SLV Borrow Rate | 0.81 %, 4.8 M shares available | Borrow pressure has cooled from the peak squeeze, but elevated vs historic norms signals ongoing tightness. | 🟠 Orange |
COMEX Silver Registered | 196.47 M oz | Open interest = 171,406 contracts × 5,000 oz = 857 M oz. Only ~22.9% of longs could stand for delivery before registered silver is exhausted. | 🟠 Orange |
COMEX Silver Volume | 74,253 | Elevated trading volume amid constrained physical availability. | 🟠 Orange |
GLD Borrow Rate | 0.5 %, 4.4 M shares available | Normal lending conditions; no immediate signal. | 🟢 Green |
COMEX Gold Registered | 20.559 M oz | Open interest = 466,174 contracts × 100 oz = 46.6 M oz. Only ~44% of longs could stand for delivery before registered gold is exhausted. | 🟡 Yellow |
COMEX Gold Volume | 282,014 | Robust turnover but not yet at extremes. | 🟡 Yellow |
UST–JGB Spread | 2.789 % | Wide divergence between U.S. and Japan bond yields; shows strain in global rate dynamics. | 🟠 Orange |
Japan 30‑Year Yield | 3.06 % | Near multi‑decade highs → pressure on BoJ yield‑curve control. | 🔴 Red |
U.S. 30‑Year Yield | 4.929 % | Elevated long‑end yield → pushes global discount rates higher, pressuring equities. | 🟠 Orange |
SOFRVOL | $2.725 T | High turnover in secured overnight funding; reflects active liquidity management. | 🟠 Orange |
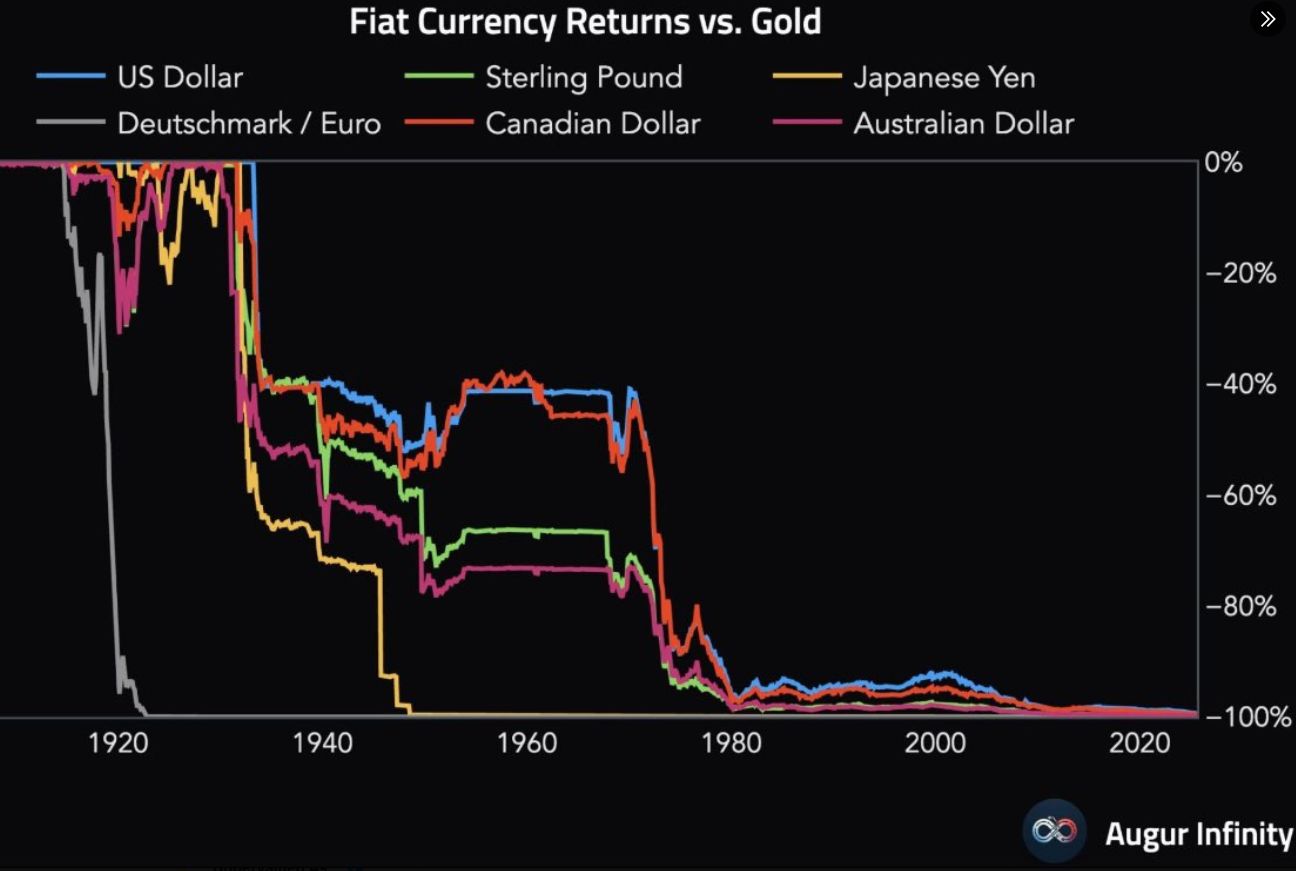
📉 Fiat Currencies vs. Gold: A Century‑Long Warning
Look at that first chart (credit: Augur Infinity) and really let it sink in.
Every colored line you see—the US Dollar, Japanese Yen, Sterling Pound, Euro/Deutschmark, Canadian Dollar, Australian Dollar—starts near the top in the early 1900s… and over time slides almost vertically toward the bottom.
🔎 Why does this matter right now?
Because we are living through another chapter in that same story—but with far more debt, far more leverage, and far more interconnected risk in the global economy than any prior generation.
👉 It’s not random that every major fiat currency has trended toward zero.
It’s baked into the design: central banks expand the money supply to paper over fiscal imbalances, and over decades the currency’s link to real value erodes.
👉 It’s not random that gold’s purchasing power has remained.
The least corrosive, most ductile, and most malleable metal known to man is the anchor that outlasts everything else.
⚠️ Read between the lines
That century‑long decline is the quiet backdrop to what we’ve been tracking in silver’s microstructure:
COMEX spreads surging.
SLV borrow rates spiking as shares disappear.
Physical supply strains showing up for those looking in the right places.
It all connects:
The same forces that hollowed out fiat currencies over the last 100 years are still at work—only now they’re amplified by exponentially greater debt loads and an increasingly fragile foundation (US Treasuries, JGBs).
🌍 East vs. West and the coming repricing
While the West leans harder on debt and synthetic collateral, the East is hoarding physical—gold, silver, and real assets.
Japan’s Tanaka restricts delivery.
China quietly hoovers up 300kg bars.
Russia launching a domestic gold exchange by year end.
They see the same chart we do.
They’re preparing for a world where paper promises are worth less and real assets dictate power.
💥 The silver pressure valve
Even after Friday’s selloff, silver’s resilience this week was another tell:
A market fighting to reprice despite a near record short position and roughly 23.8% under it’s January 1980 all time high.
A market whispering—loudly—that the first era of silver ignored as a monetary metal is ending.
When fiat erodes more quickly, history shows us exactly what happens:
✅ Gold reclaims center stage.
✅ Silver follows—explosively and spectacularly.
This isn’t hype. It’s the same pattern, over and over.
The only question left is:
When will the world wake up and mark these metals to their true value?
🥇🥈 Bottom Line – The Signals Are Clear
Even after decades of distortions, silver still trades ≈23.8% below its January 1980 high of $50.36/oz—even as SLV borrow stress and COMEX signals whisper that physical supply is under real strain.
History tells us when confidence in debt‑backed promises cracks, capital surges back into real collateral.
This is all while cracks in the bedrock of global finance and the heart of global liquidity—USTs, JGBs, 10 Year Swap Spread, 3 Year SOFR OIS stress—keep widening.
History shows us what happens when confidence in debt‑backed promises falters: capital rushes back to real, pristine collateral.
That’s why I help people rotate into gold and silver through HardAssets Alliance—a platform built for simplicity on top of world‑class infrastructure:
✨ Best pricing in real time. Behind every order, top global wholesalers and refiners compete—so you get the best available price without haggling.
✅ Fully allocated. Your bars. Your coins. Your name. No pooled promises. Take delivery anytime—or sell instantly through the marketplace.
🛡️ Comprehensive insurance. Every ounce stored is fully insured through Lloyd’s of London—no extra cost.
🏰 Fortress‑grade security. 24/7 vault staff, biometric access, independent audits, and verified holdings across five vaults worldwide.
If you want to explore setting up your own fully allocated gold and silver position before the next squeeze hits, reach out—I’d be honored to help. 📩
Luke Lovett
📲 Cell: 704.497.7324
🌐 Undervalued Assets | Sovereign Signal
📧 Email: [email protected]
🔐 Legal Disclaimer 🔐
The content provided herein is for informational and educational purposes only and should not be construed as financial, investment, legal, or tax advice. I am not a licensed financial advisor, investment professional, or attorney. The views expressed are solely those of the author and are not intended to be relied upon for making investment decisions.
While every effort has been made to ensure the accuracy of the information presented, no guarantee is given that all content is free from error, omission, or misinterpretation. Market data, trends, and conditions are subject to rapid change, and past performance is not indicative of future results.
Some views expressed may reference public insights from respected analysts and commentators. Some third-party content may be paraphrased or summarized for educational purposes only, with attribution, and does not imply endorsement or affiliation. All rights remain with the original creators.
Always conduct your own research and consult with a licensed financial advisor or registered investment professional before making any investment decisions. By reading this publication, you agree not to hold the author liable for any losses or damages resulting from the use of this information.
I am not a metals dealer. All orders are processed directly by a licensed precious metals dealer. I do not hold funds, process transactions, or provide personalized investment advice.
Reply