- The Sovereign Signal
- Posts
- The Overflow Tank Is Empty, the Long End Is Buckling, and Leverage Is Maxed Out
The Overflow Tank Is Empty, the Long End Is Buckling, and Leverage Is Maxed Out
Reverse repos drained to $20B (no cushion), SOFR (overnight funding) volume chained near an all time high of $2.88T, and SOFR (overnight) funding rate pinned at 4.39% — the system is rolling more leverage than ever just to stand still. At the same time, SLV borrow is spiking (0.71%) with scraps of available shares to borrow, while U.S. 30-year yields (4.855%) and Japan’s (3.231%) grind higher together. This is structural fragility bending the market deeper and deeper into distortion: a maxed-out system that has nowhere left to run but back to gold and silver, the only base layer collateral that has stood the test of time.
Luke Lovett
September 05, 2025
The signals are screaming, but almost nobody hears them.
SLV’s (largest silver ETF in the world) borrow rate just spiked to 0.71% with only 700,000 shares left.
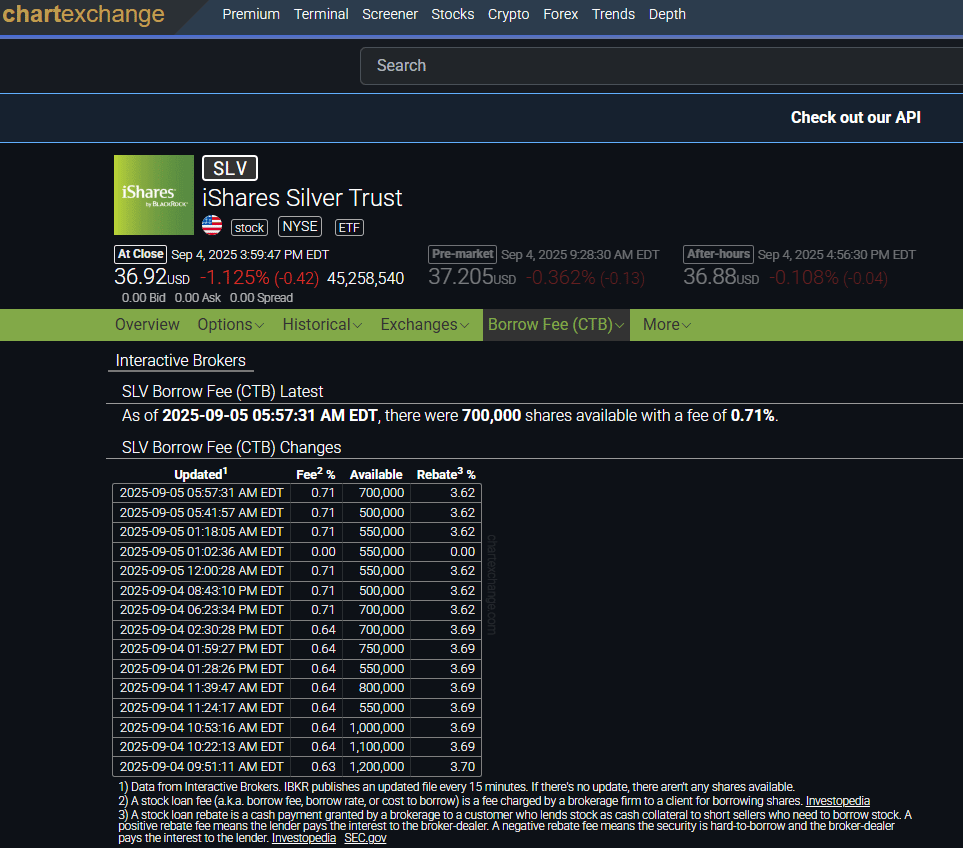
That’s not a flicker; that’s the smell of ignition in the collateral chain. When the cheapest-to-deliver asset gets scarce, it’s not a niche event — it’s the monetary equivalent of oxygen thinning in a room full of open flames.
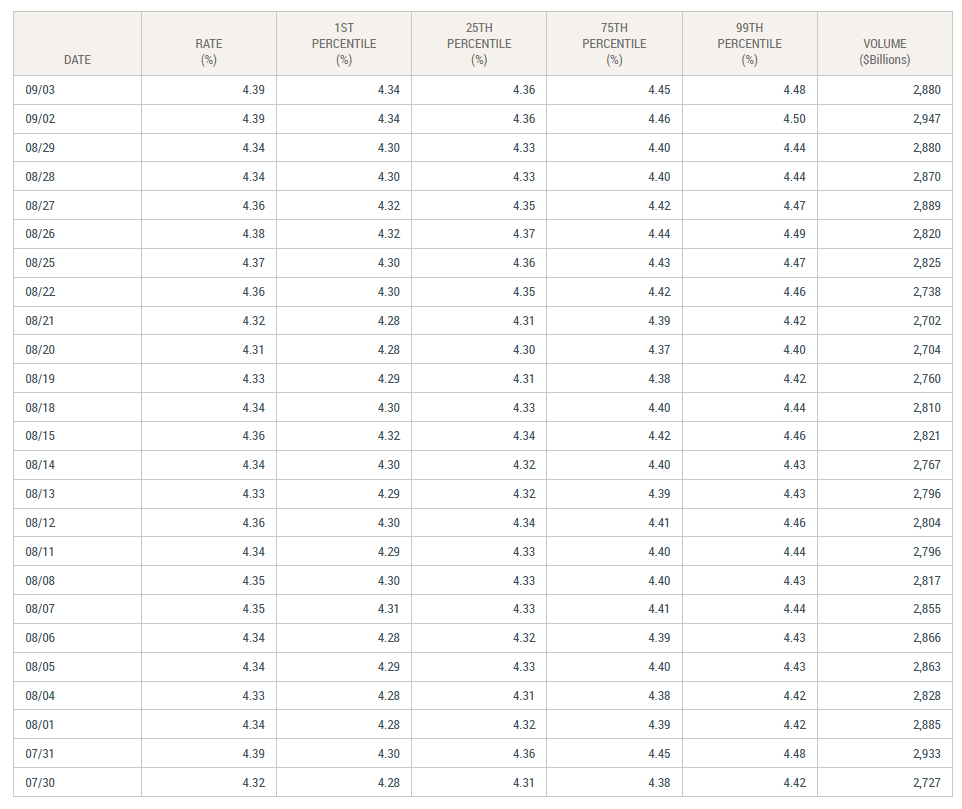
SOFR is pinned at 4.39% while daily rollover volume sits at $2.88 trillion.
Credit to newyorkfed.org for the above screenshot
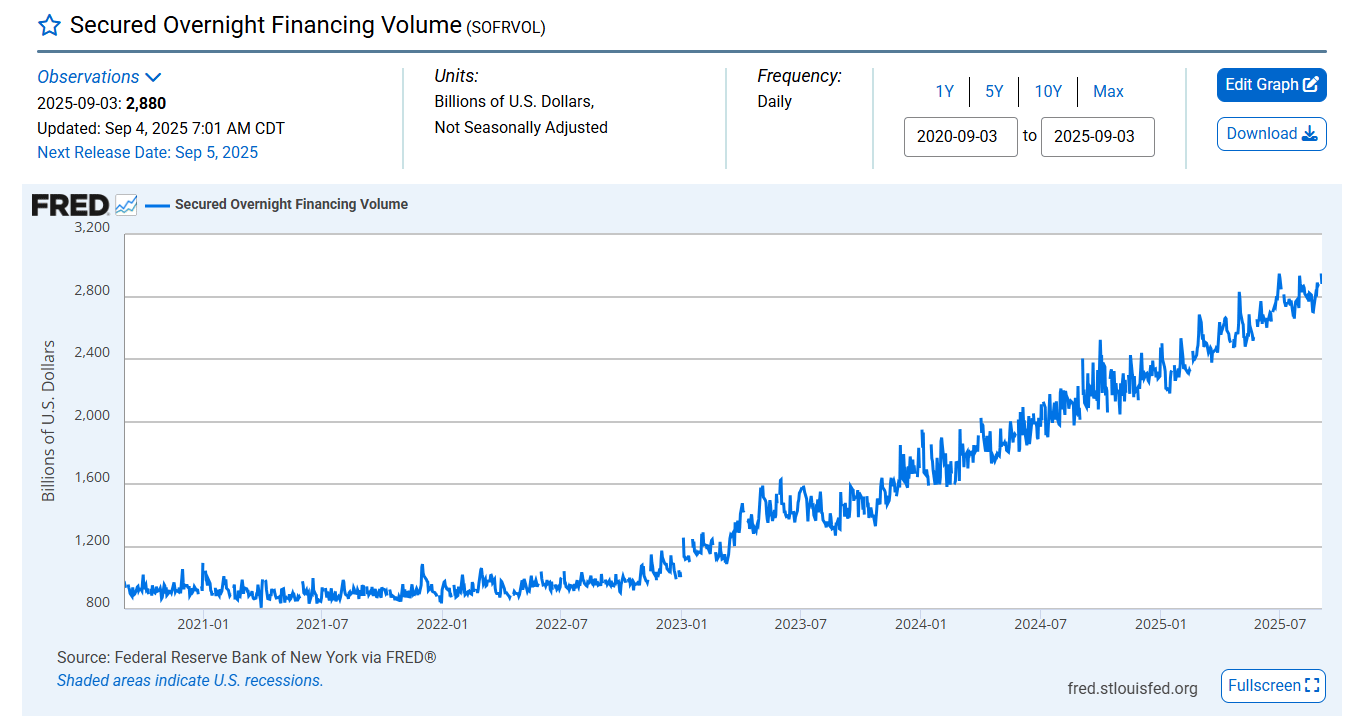
That’s the definition of a treadmill economy: the system must refinance trillions every single night just to keep standing.
Record volume means the belt is spinning faster than ever. A single stumble, a single slip — and the body flying off isn’t one bank, it’s the entire market structure.
Reverse repos sit at $20 billion — a rounding error in a $25 trillion Treasury market.
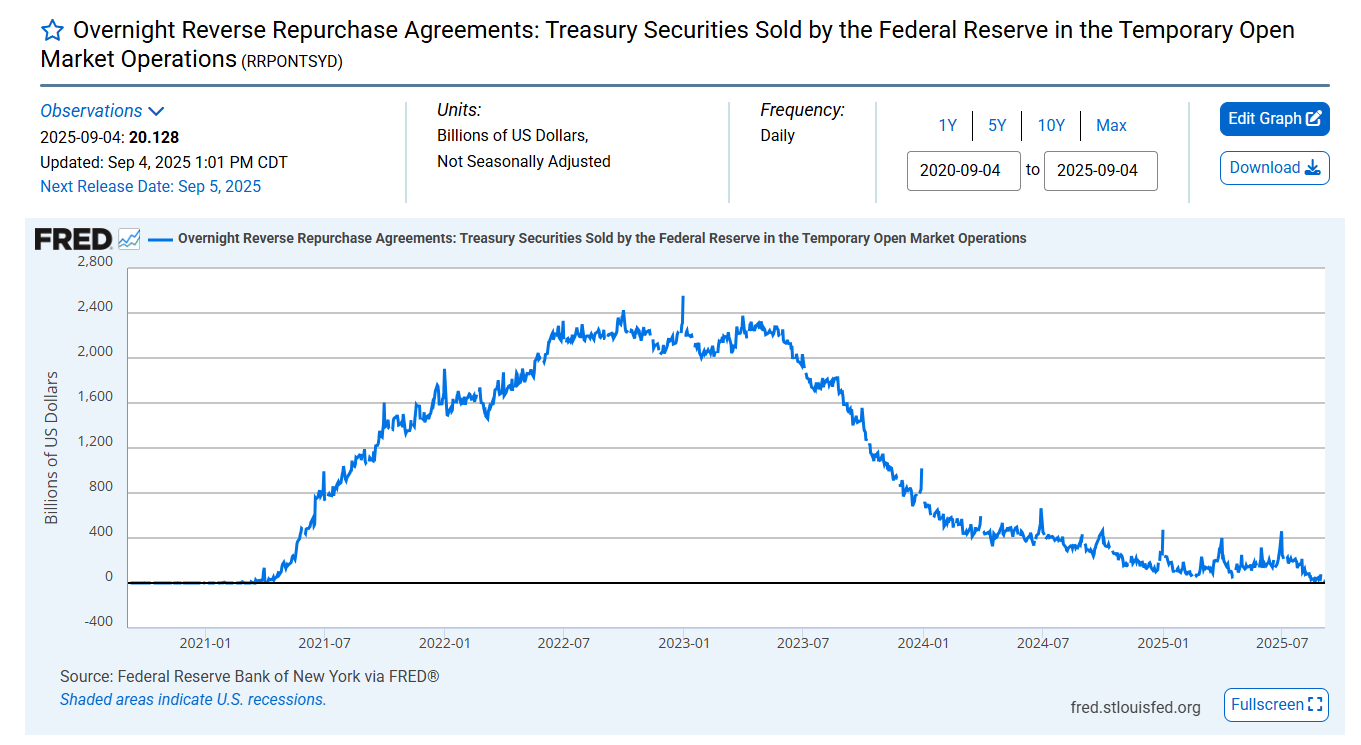
The overflow tank is dry. There’s no buffer left.
Every new dollar of collateral stress, every hiccup in funding, hits the bloodstream directly. This is living without kidneys: the toxins of excess issuance and leverage circulate without filtration.
Signal | Latest Level | Interpretation | Zone |
|---|---|---|---|
10-Year Swap Spread | –25.37 bps | Still deeply negative. Confirms ongoing impairment in cash Treasuries: dealers continue preferring swaps (synthetic exposure) over warehousing real bonds. | 🔴 Red |
Reverse Repos (RRP) | $20.128B | Slight bounce from prior lows, but the Fed’s “overflow tank” is still effectively empty. Cushion remains gone; every new dollar of funding demand must clear in live markets. | 🔴 Red |
USD/JPY | 148.18 | Danger band intact; hovering near critical tripwires. Carry trade fragility persists, volatility risk elevated. | 🟠 Orange |
USD/CHF | 0.8033 | Hugging the 0.80 danger line. Safe-haven demand remains active, showing persistent systemic fragility. | 🟠 Orange |
3-Year SOFR–OIS Spread | 28.13 bps | Still stretched near the 30 bps stress threshold. Lenders charging a “future anxiety premium.” Confirms entrenched term-funding stress. | 🔴 Red |
SOFR Overnight Rate | 4.39% (pinned) | Funding costs remain at cycle highs. Even with “ample reserves,” repo pipes are tight. | 🟠 Orange |
SOFR Daily Volume (SOFRVOL) | $2.88T | Just shy of record highs. Market chained to extreme nightly rollovers, a paycheck-to-paycheck liquidity regime. | 🟠 Orange |
SLV Borrow Rate | 0.71% (500K avail.) | Borrow costs rising and share availability collapsing sharply. Signs of ignition in the silver collateral chain. | 🔴 Red |
COMEX Silver Registered | 195.23M oz | Cushion marginally higher but still wafer-thin relative to paper leverage. | 🟠 Orange |
COMEX Silver Volume | 71,062 | Moderate activity; steady turnover suggests positioning digestion. | 🟡 Yellow |
COMEX Silver Open Interest | 157,116 | Elevated, leverage intact. Market continues directional positioning. | 🟠 Orange |
GLD Borrow Rate | 0.27% (5.1M avail.) | Costs easing further, availability adequate. Funding remains loose for gold. | 🟡 Yellow |
COMEX Gold Registered | 21.3M oz | Flat, still razor-thin stocks compared to paper exposures. | 🟡 Yellow |
COMEX Gold Volume | 254,684 | Strong activity; confirms deep positioning in gold futures. | 🟠 Orange |
COMEX Gold Open Interest | 503,525 | New high, showing continued leverage and robust speculative positioning. | 🟠 Orange |
UST–JGB 10Y Spread | 2.58% | Narrowing again toward fragility levels. Below 2.5% = carry danger; hovering near that threshold. | 🟠 Orange |
Japan 30Y Yield | 3.231% | Near all time highs. Persistent upward pressure remains a threat to global bond stability. | 🔴 Red |
US 30Y Yield | 4.855% | Long-end heavy. Debt fragility at the global base layer remains acute. | 🟠 Orange |
Meanwhile, long-end yields in the U.S. (4.855%) and Japan (3.231%) rise in tandem.
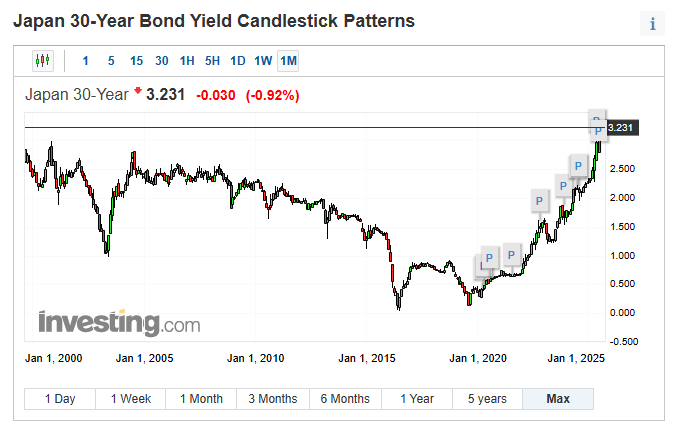
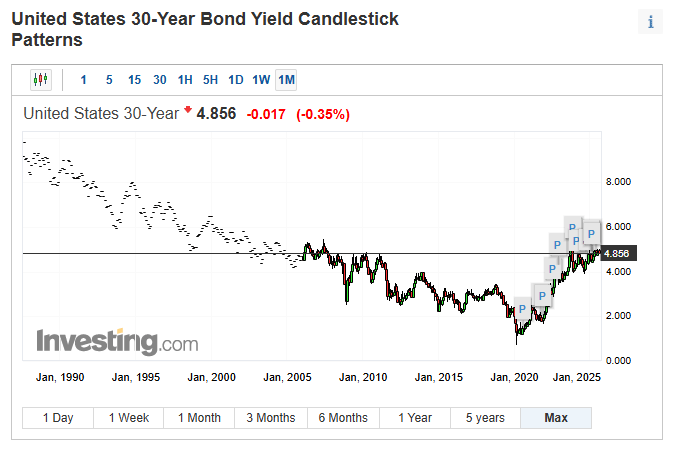
Two of the world’s anchor bond markets are buckling under the same gravitational strain.
This is not regional noise. It’s systemic duration stress radiating across the global spine. Japan is the canary, and the U.S. is the mine.
Japan holds more U.S. Treasuries than anyone else. For decades, they bought our long bonds to earn a little extra yield and anchor their markets.
But now their own 30-year bond is near all-time highs, and the cost of hedging dollars back into yen has exploded. Suddenly, Treasuries don’t look like a bargain — they look like dead weight.
So what happens? Japan pulls back. Demand for U.S. long bonds thins. Our 30-year yield starts to climb in sympathy with theirs. The largest two bond markets in the world — the U.S. and Japan — are moving higher together, like tectonic plates grinding at the same time.
That pressure doesn’t stay hidden. It rips through the foundation of global finance. Equities live on low long-end yields. Rising yields mean higher discount rates, lower valuations, shrinking multiples. Stocks start to wobble. And here’s the kicker: 15–18 years ago, the U.S. could take more pain.
Debt was smaller, deficits less bloated. Today, the debt mountain is so much taller that every tick higher in the 30-year burns hotter. We don’t have the same room to run.
Put simply:
Japan is backed into a corner.
U.S. debt is heavier than ever.
Both long ends are rising together.
That’s not noise — that’s pressure building in the two largest bond markets on earth. And when those anchors strain, global equities feel it immediately.
Gold and silver don’t need the crash to benefit. They just need this slow, grinding fragility to keep piling up. Because when the dam finally cracks, capital won’t disappear — it’ll stampede back to the oldest, truest collateral humanity has ever trusted.
Gold and Silver: The Most Undervalued Assets in Recorded History
In 1980, U.S. federal debt stood at $908 billion.
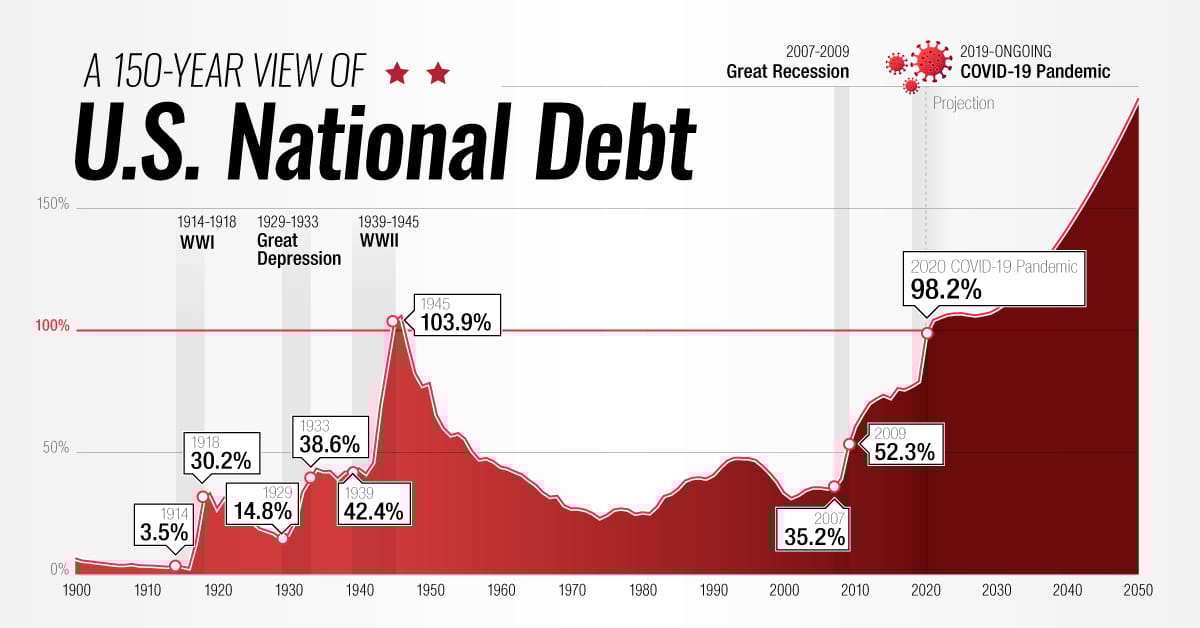
Credit to visualcapitalist.com for the above image
Today it’s roughly $37.31 trillion — a 4,006% increase (over 41 times higher in just 45 years).
Now compare that to gold and silver:
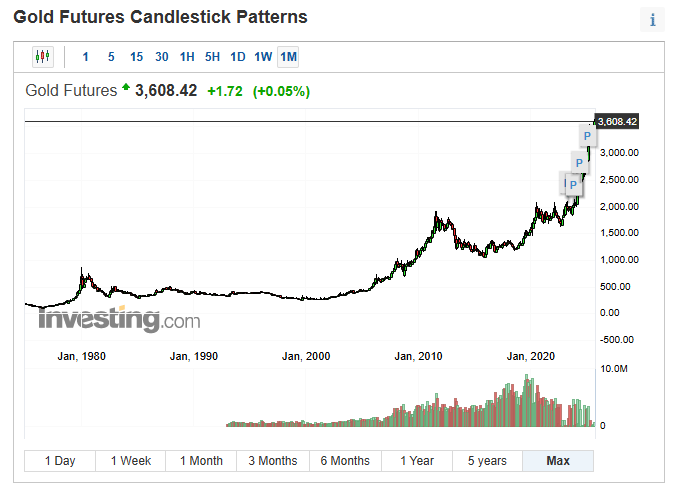
Gold peaked around $850/oz in 1980. Today it trades near $3,608/oz — that’s about a 324% increase.
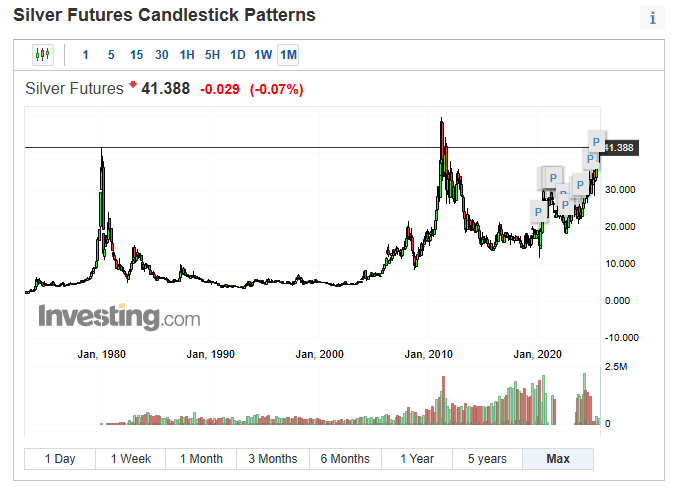
Silver peaked near $49/oz in 1980. Today it’s only about $41.4/oz — actually 15% below its level from 45 years ago.
So:
Debt up 4,006%.
Gold up 324%.
Silver down 15%.
That’s not just undervaluation — it’s absurd.
The global financial system has piled on forty-one times more debt, yet the base-layer collateral that has anchored value for millennia has barely moved.
This is the greatest disconnect in financial history. It’s not a matter of if gold and silver reprice to match the scale of monetary debasement — it’s a matter of when.
The base layer is quietly rotating back to what has always worked, away from debt towards intrinsic value. And when the floodgates open, capital won’t trickle; it will stampede.
⚡ Bottom line: Debt up 4,006%. Gold up 324%. Silver down 15%. The case is screaming: gold and silver are the most undervalued assets in recorded history.
Here’s the math:
Debt growth since 1980: 41.1x
If gold had tracked debt: it would be about $34,927/oz today
If silver had tracked debt: it would be about $2,013/oz today
⚡ Bottom line: If gold and silver had simply risen in line with U.S. debt since 1980, gold would be ten times higher than it is now, and silver would be almost fifty times higher. The disconnect is not just large — it’s historic.
The Fed cut rates 100bps last September, but the long end didn’t listen. Borrowing costs kept climbing, the 10 year swap spread went deeply negative, and the plumbing kept breaking. That’s the tell: debt is no longer a stable base layer.
When the “safe” collateral of Treasuries starts to disobey the Fed, the whole illusion cracks. Reverse repos drained, SOFR (overnight funding volume) rolls making new record highs every few months, long-end yields in the U.S. and Japan pressing cycle peaks — that’s not stability, that’s malfunction.
And when the new base layer fails, capital has no choice but to stampede back to the old one. Gold and silver aren’t hedges anymore. They’re the only collateral left that the system can trust.
Why I Use HardAssets Alliance
HardAssets Alliance provides:
100% insurance of metals for market value
Institutional-grade daily audits and security
Best pricing — live bids from global wholesalers
Fully allocated metal — in your name, your bars
Delivery anytime or vault-secured across 5 global hubs
Luke Lovett
Cell: 704.497.7324
Undervalued Assets | Sovereign Signal
Email: [email protected]
Disclaimer:
This content is for educational purposes only—not financial, legal, tax, or investment advice. I’m not a licensed advisor, and nothing herein should be relied upon to make investment decisions. Markets change fast. While accuracy is the goal, no guarantees are made. Past performance ≠ future results. Some insights paraphrase third-party experts for commentary—without endorsement or affiliation. Always do your own research and consult a licensed professional before investing. I do not sell metals, process transactions, or hold funds. All orders go directly through licensed dealers.
Reply