- The Sovereign Signal
- Posts
- 🌏 When Sovereign Bedrocks Crack: Japan & U.S. Debt, Swap Spreads, and the Rotation Back to Gold & Silver
🌏 When Sovereign Bedrocks Crack: Japan & U.S. Debt, Swap Spreads, and the Rotation Back to Gold & Silver
The 10‐Year Swap Spread and 3‐Year SOFR‐OIS have been front‐running today’s stress in JGBs and U.S. Treasuries — as the base layer quietly rotates back into gold, silver becomes the pressure‐release valve poised to erupt.
Luke Lovett
July 16, 2025
If you want to know where the real stress points are in this system, don’t just watch the price of silver — watch what people are paying to borrow it from the largest silver ETF in the world.
Last week on July 10th at 9:19:13AM EDT, SLV’s borrow fee sat at just 0.68% with around 4.1 million shares available.
Look what’s happened since then:
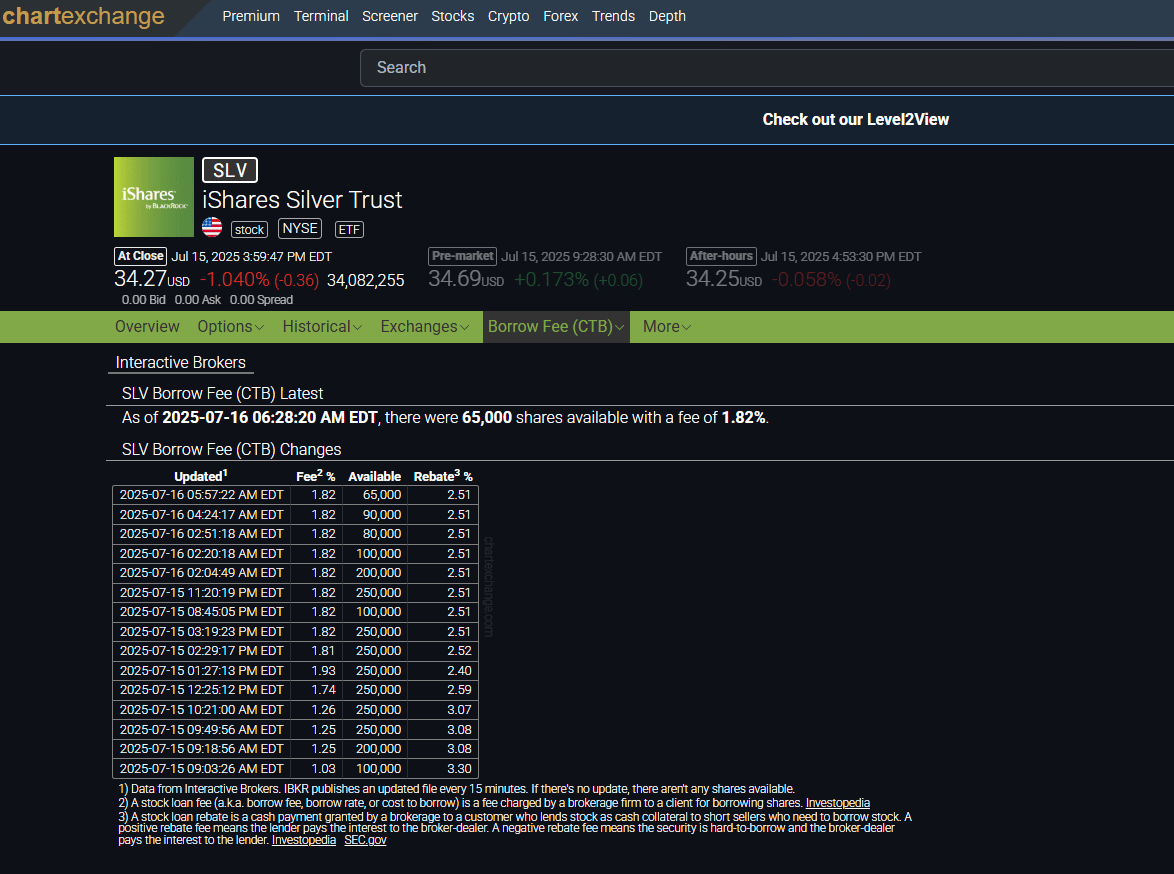
✅ Yesterday morning, there were moments when zero shares were available to borrow while the borrow rate sat at 1.03%.
✅ At 01:27:13 PM EDT yesterday, the rate had spiked all the way to 1.93%.
✅ As of 5:57:22AM EDT this morning, it’s holding at 1.82% with only 65,000 shares available.
👉 That’s not random noise.
It’s the tape quietly screaming that shorts are paying up, collateral is scarce, and the pressure to meet margin requirements is mounting.
Silver’s daily chart tells the same story in price action: a high‑velocity climb to $39, a healthy shakeout to $38.29, and then coiling energy.
Markets don’t go straight up — they breathe, consolidate, and then lunge.
💡 But zoom out.
These micro‑signals are happening against a backdrop where the very foundation of global finance — sovereign debt — is creaking.
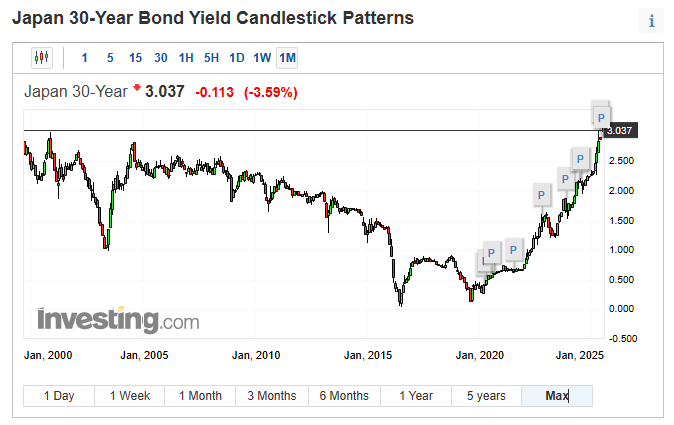
📈 Japan’s 30‑Year yield is now 3.037%, near new record highs.
📈 The U.S. 30‑Year is above 5%.

Japan and the United States don’t just participate in global finance — their sovereign debt markets form its foundation.
These are the two largest government bond markets on Earth, and together they function as the base layer collateral for the entire financial system.
Every repo, every swap, every derivative, every overnight loan is ultimately anchored to the assumption that JGBs and U.S. Treasuries are rock‑solid and infinitely liquid.
When yields in these markets start rising in tandem — Japan’s 30‑Year screaming past 3% and the U.S. 30‑Year above 5% — it’s not just a regional issue.
👉 It’s the ground itself shifting beneath the global monetary structure.
🇯🇵 Japan is the largest foreign holder of U.S. Treasuries.
Every decision Tokyo makes reverberates through the entire global financial system.
Here’s the setup:
When bond defense is on, Japan keeps buying its own debt to contain yields and lets the yen weaken.
💴 A weaker yen supercharges the carry trade — cheap yen borrowed to chase yield everywhere else: Treasuries, emerging markets, commodities.
But this ramps leverage to dangerous levels to set up a bigger unwind the next time.
The longer this goes on, the bigger the position that must eventually be unwound when Japan is forced to defend its currency or liquidity evaporates.
The signals have been flashing for months:
⚠️ The tell?
The deeply negative 10‑Year swap spread (now ‑30.5 bps) has been forecasting this—dealers preferring synthetic hedges over Treasuries themselves, a sign that trust in the collateral layer is fraying.
⚠️ Another tell: the 3‑Year SOFR–OIS spread stuck in the mid to upper 20s, quietly screaming that markets expect sustained funding stress in the very pipes of the system.
💭 Read between the lines:
A system leaning harder on overnight funding (repos and reverse repos = QE) and swaps, with sovereign yields rising in sync, is a system whispering that the base layer is cracking.
And when the base layer trembles, markets look for a release valve.
🥇 The base layer of the global financial system is slowly rotating back into gold — and silver is that lagging release valve.
For decades, sovereign debt (U.S. Treasuries and JGBs) has been treated as the bedrock collateral.
But as that foundation wobbles, the system quietly reaches for what has always been trusted: real value.
🥈 Silver has been a primary form of currency for over 5,000 years.
From the first metal used as a currency in ancient Mesopotamia to the first international reserve currency as the Spanish silver dollar to connecting the East and West on the Silk Road, it has always been a favorite means of exchange.
And now, we see it getting ready to rip higher:
Rising SLV borrow rates… vanishing borrow availability… signals of mounting pressure as shorts scramble.
When trust in sovereign collateral erodes, gold becomes the anchor — and silver, the lagging release valve, begins to roar.
📌 Watch these signals together — they’re not isolated. They’re the heartbeat of the core of liquidity and collateral in the system.
Signal | Latest Level | Interpretation | Zone |
|---|---|---|---|
10‑Year Swap Spread | –30.5 bps | Deeper inversion. Market prefers synthetic hedges over real Treasuries. A sign of structural distrust in collateral. | 🔴 Red |
Reverse Repo (RRP) | $198.277 B | Still above the $100B tripwire, but trending down from over 2 trillion shows tightening liquidity. | 🟠 Orange |
USD/JPY | 148.68 | Expect this to keep weakening as long as JGB’s are elevated. BOJ can’t defend both bond market and currency at the same time. | 🟠 Orange |
USD/CHF | 0.8014 | Near historic lows but back above .8 for now. | 🟠 Orange |
3‑Year SOFR–OIS Spread | 26.5 bps | Markets still pricing in prolonged forward funding stress and curve distortion. | 🟠 Orange |
SOFR Overnight Rate | 4.33% | Nominally steady but diverging from forward expectations. Base layer remains mispriced. | 🟢 Green (surface-level only) |
SLV Borrow Rate | 1.82% | 🔥 Surging. Available shares collapsed from 4.1M → 65,000. Shorts are paying more to source silver with almost no shares left to borrow. Watch this. | 🔴 Red |
GLD Borrow Rate | 0.54% | Stable for now. | 🟡 Yellow |
COMEX Gold Inventory | 36,748,662.05 oz (20.2M Registered) | Inventory unchanged, but open interest down to 450,276 contracts keeps the cover ratio tight. | 🟡 Yellow |
10Y UST – JGB Spread | 2.908% | Spread popping again. Rising yields in both markets signal tightening linkage — Japan’s stress is transmitting into U.S. Treasuries. | 🟠 Orange |
🌐 Two Giants, One Fragile Base Layer
When we talk about the global financial system, it’s easy to think in silos: Japan over there, the U.S. over here.
But in reality, the Japanese Government Bond (JGB) market and the U.S. Treasury market are two pillars of the same base layer.
Together they form the largest sovereign debt markets in the world — the collateral backbone that props up every repo, every derivative, and every equity valuation built on top.
📌 This can’t be emphasized enough…
Japan holds more U.S. Treasuries than any other foreign nation.
Their central bank and institutions use Treasuries interchangeably with JGBs as balance‑sheet collateral.
When JGB yields rip higher — as we’re seeing with Japan’s 30‑year pressing all‑time highs — it forces choices:
Defend the bond market.
Sell foreign reserves (often Treasuries) to shore up liquidity, or print more yen and fuel currency weakness.
Either way, that stress reverberates directly into the U.S. Treasury market… which we now see with U.S. 30‑year yields punching above 5% in lockstep.
📉 Why rising yields = pressure on equities
Sovereign yields are the benchmark cost of capital.
When they rise:
Discount rates go up. Future earnings are worth less in present value terms.
Debt service gets more expensive. Corporates reliant on cheap refinancing see margins squeezed.
“Risk‑free” alternatives become more attractive. A 5%+ yield on Treasuries competes directly with equity risk.
This is why equity markets feel every tremor in the bond markets — because their lofty valuations have been built on a foundation of ultra‑cheap sovereign yields.
⚠️ The bigger picture
When both JGBs and U.S. Treasuries — the twin anchors of the system — start to wobble together, equities aren’t just reacting to isolated news.
They’re responding to a deeper message:
The cost of leverage is rising, the base layer of collateral is unstable, and the entire pyramid of risk assets is forced to reprice.
Everyone watches the headline yields. But the smartest desks—watch the plumbing.
Two of the most important “early warning” gauges in that plumbing have been screaming for months:
📉 The 10‑Year Swap Spread: Deeply Negative, a Silent Alarm
In a healthy debt market, the swap spread (the difference between the fixed rate in interest rate swaps and the yield on a comparable Treasury) is positive.
A positive spread signals that Treasuries are viewed as the safest collateral and therefore trade at a premium.
But what we’ve seen lately is persistent, deeply negative spreads close to –30 bps on the 10‑year:
🔻 –30.5 bps this morning, not a blip but a structural inversion.
That means the market is preferring swaps over actual Treasuries—a stunning signal that Treasuries, the supposed gold standard of collateral, are losing their preferred status.
In other words, the market is quietly saying: “We don’t believe this base layer is risk‑free anymore.”
👉 This inversion tends to precede periods where yields rise uncontrollably, because it reflects deteriorating confidence in sovereign debt as collateral.
The negative swap spread has been front‑running the blowout we’re now seeing in JGBs and U.S. long bonds.
⚡ The 3‑Year SOFR‑OIS Spread: Forward Stress in Funding
The SOFR‑OIS spread is another under‑the‑hood gauge, comparing overnight funding rates (SOFR) to the Overnight Index Swap.
It reflects market expectations of future funding stress.
Over the past months, we’ve seen:
📈 Persistent spreads in the mid‑20 bps range (26.5 bps this morning)
That’s not a transient spike. It’s a steady signal that markets expect elevated overnight funding strain for years ahead.
What does that mean?
Repo markets are already strained. Institutions are paying up for overnight liquidity—even three years out.
This aligns with what we’re seeing in rising SLV borrow rates and other collateral stress signals: liquidity is becoming more expensive and harder to find.
🌐 How These Two Signals Connect to the Japan/U.S. Dynamic
When you overlay these plumbing indicators with the sovereign yield charts, the pattern becomes clear:
Negative swap spreads = markets questioning the very collateral quality of Treasuries.
Persistent SOFR‑OIS stress = markets pricing in a future where overnight funding is not abundant.
➡ Put together, they’ve been forecasting a world where:
Sovereign bond markets (JGBs, Treasuries) are no longer untouchable.
Yields rise not because of growth, but because of funding fragility.
The foundation of the financial system itself is being stress‑tested—months before it shows up in headline yields.
⚔️ The Bigger Picture
These signals have been begging the market to listen:
📉 10‑Year Swap Spread said: “Collateral trust is breaking.”
⚡ 3‑Year SOFR‑OIS said: “Funding stress is structural, not transitory.”
Now we see the visible manifestation:
🇯🇵 JGB yields ripping higher as the BOJ defends its bond market at the cost of the yen.
🇺🇸 U.S. 30‑year yields popping above 5%, the base layer wobbling in tandem.
🥈 SLV borrow rates surging, a short‑squeeze pressure release as synthetic markets stretch to breaking.
📌 Bottom Line:
The plumbing told us this was coming. The “base layer” is groaning.
And in a system built on sovereign debt, those cracks ripple everywhere—through equities, through FX, and finally into precious metals like silver, which acts as the ultimate pressure valve.
⚖️ When the Base Layer Wobbles, the Ancient Anchors Call
For decades, the global financial system has rested on a simple assumption:
U.S. Treasuries and JGBs are unshakable bedrock.
They’ve been the pristine collateral that props up every repo, every derivative, every leveraged trade.
But what we’re seeing now — JGB yields ripping higher even as the BOJ intervenes, U.S. 30‑year yields pushing above 5%, a 10‑year swap spread buried deep in negative territory, and a 3‑year SOFR‑OIS spread that refuses to normalize — all whispers the same truth:
the bedrock is fracturing.
When the base layer begins to strain, capital starts to reach back for what it trusted before the age of paper promises.
🥇 Gold Quietly Reclaims Its Throne
As sovereign debt markets wobble, you can feel a subtle rotation — reserve managers, sovereign wealth funds, and long‑view allocators slowly re‑anchoring into gold.
Not as a trade, but as a foundation.
The plumbing data — swap spreads, SOFR‑OIS stress — have been forecasting this shift: a world where debt is no longer unquestionable.
🥈 Silver: The System’s Release Valve
Gold becomes the anchor.
Silver becomes the release valve.
For over 5,000 years, silver has been the monetary metal of the people — from Mesopotamian shekels to the Spanish silver dollar, the first true international reserve currency.
And now, as today’s synthetic markets strain, you can see the pressure building:
📈 SLV borrow rates climbing from 1.03% to 1.82% in the past 24 hours.
📉 Borrowable shares down from 4.1 Million to 65,000 since July 10th.
⚡ A short‑squeeze dynamic beginning to take shape.
These are not random blips; they’re signals that the hidden gears of the system are grinding, and silver is feeling that torque.
💡 Position Yourself in Real Value
As this slow rotation back to tangible collateral unfolds, you don’t have to sit on the sidelines.
I can personally connect you with major U.S. precious metals dealers I’m partnered with for preferred pricing —
✅ Fully insured delivery right to your door,
✅ Secure vault storage options,
✅ Only practical, widely‑recognized forms of gold and silver (no rare or numismatic coins — just bars, rounds, and sovereign‑minted coins).
If you want to position yourself before these pressures fully break into the open, just reply or reach out directly — I’ll make sure you’re set up with the same reliable channels I use myself.
Luke Lovett
📲 Cell: 704.497.7324
🌐 Undervalued Assets | Sovereign Signal
📧 Email: [email protected]
🔐 Legal Disclaimer 🔐
The content provided herein is for informational and educational purposes only and should not be construed as financial, investment, legal, or tax advice. I am not a licensed financial advisor, investment professional, or attorney. The views expressed are solely those of the author and are not intended to be relied upon for making investment decisions.
While every effort has been made to ensure the accuracy of the information presented, no guarantee is given that all content is free from error, omission, or misinterpretation. Market data, trends, and conditions are subject to rapid change, and past performance is not indicative of future results.
Some views expressed may reference public insights from respected analysts and commentators. Some third-party content may be paraphrased or summarized for educational purposes only, with attribution, and does not imply endorsement or affiliation. All rights remain with the original creators.
Always conduct your own research and consult with a licensed financial advisor or registered investment professional before making any investment decisions. By reading this publication, you agree not to hold the author liable for any losses or damages resulting from the use of this information.
I am not a metals dealer. All orders are processed directly by a licensed precious metals dealer. I do not hold funds, process transactions, or provide personalized investment advice.
Reply