- The Sovereign Signal
- Archive
- Page 9
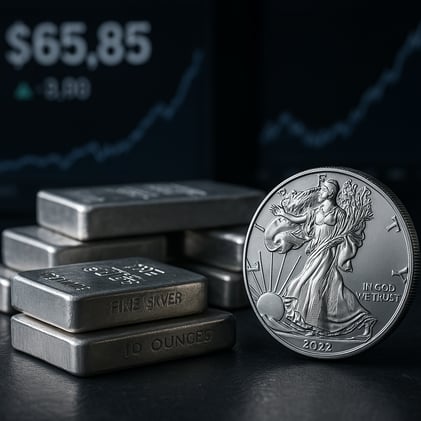
Silver Closes The Week at $65.85 In China - Asia Driving Silver Higher, Leveraged Longs Get Cleared Out In Friday's Price Dip But Silver Lease Rates Spiking Back Up To 9% In London Suggests Short-Term Bullish Momentum Is Still Intact
Asia’s premium is pulling the tape higher while Friday’s 10% margin hike merely shook out weak leverage. With London lease rates back near 9%—a signature of tight collateral and rising borrow costs—dips look like refuels, not reversals, as the path toward $70 and beyond stays open.
Silver To S&P Ratio Indicates Silver Bull Is Just Beginning, Rumors of Chinese Exchange Halting For 1 Hour After Premiums Hit 20%, COMEX Raises Margin Requirements 10% On Silver Effective Today, Heavy Call Volume at $65 Indicates Next Ignition Point
Signals are stacking: collateral stress and option-gamma tinder meet a tightening physical market. If $65 holds, a forced-buyer cascade can collide with shrinking float—sending the silver bull vertical.
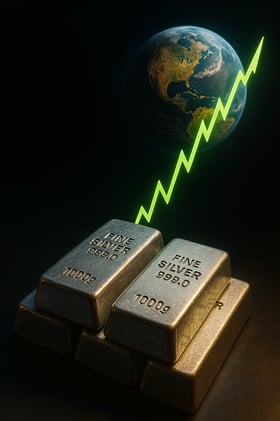
Silver Primed To Head Towards $70 & Eventually Beyond $333 As Silver February Call Options Nearly Double And 9-Day Flag Formation Broken, Golden Fibonacci Extension Suggests $71 for SLV, Global Debt Reaches $345.7 Trillion - 310% of Global GDP
Debt super-cycle, hard-asset rerate: with global debt at 310% of GDP and options flow torching the ceiling, silver takes the stairs two at a time—$70 first, then the long climb toward a three-handle.
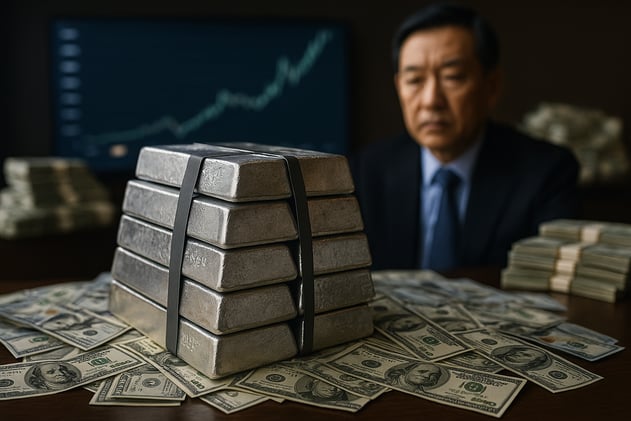
Rumors of Massive Asian Silver Buyer Refusing Cash Offers For End of Year Silver Delivery, COMEX Physical Silver Raid Slows But Continues, Bloomberg Says Silver May Test $63, Japanese Yields Continue To Soar, Fed Announces $45 Billion In Monthly Debt Buybacks Starting In January
Physical is king, funding is fragile: real buyers want bars, not cash; vaults thin as Japan wobbles and the Fed turns the hose back on—silver leads the repricing.
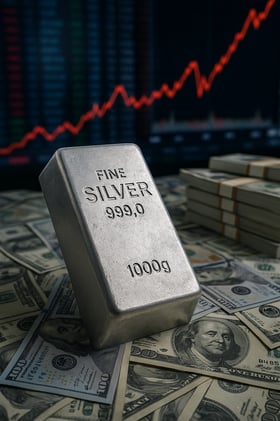
$58.80 Is The Trigger Right Now In Silver, 2nd Largest Silver Producer Implementing Export Restrictions on Jan 1st, Japan Continues To Move Markets Towards Global Margin Call, Hedge Funds Overcrowding AI Trade More and More, U.S. Debt Has Increased 1,100% Since 1990, Consumer Credit Tightening
Japan continues to inch markets closer and closer to a global margin call. Can we guess which assets will benefit the most from next cycle of easing?
Silver Closes At Yet Another All-Time Weekly High While Shorts Standing for Physical Delivery, Western Retail Buyers Are Starting To Enter The Market, India's Central Bank Just Cut Rates, And Real Borrowing Costs Are No Longer Obeying Fed Rate Cuts
When rates cut but real yields won’t obey, capital flees paper; shorts grab bars, retail is waking up—silver leads the revaluation. M2 Money Supply makes yet another new all time high.
Overnight Funding Liquidity Taps Aligning With Silver Price Direction, 50% Of COMEX Free-Float Silver Claimed In First 4 Days Of December, Japan Closer And Closer To Wreaking Havoc In Global Markets, 43% of Central Banks Set To Increase Gold Holdings Next Year
The carry trade machine gets ready to seize while central banks hoard more and more bullion—overnight cash liquidity props the system as physical drains; silver leads the revaluation.
"Do Not Compare Silver To Silver." Banks Not Accurately Forecasting Silver Price, Bank of Japan Intervened For the 147th Time This Year, Overnight Funding Volume Hits Yet Another Record, Precious Metals' About To Get The Green Light For 401Ks, Copper Shortage Ahead
Collateral is cracking and policy is loosening; the West isn’t positioned, the pipes are running on overnight credit, and price discovery is migrating to metal—gold anchors, silver detonates, copper queues next.

44% Of Available COMEX Silver Now Claimed, 81% Chance of Very Dovish New Fed Chair, MBS Repo Just Soared To 2019 Crisis Levels, Japanese Yields Going Through The Roof, And Overnight Funding Rate Elevated For 4th Night In A Row
Collateral is failing in plain sight—COMEX silver is being claimed, MBS is in triage, yen carry is snapping, and SOFR is screaming—so capital is sprinting to base-layer money: gold for security, silver for upside. Don't worry, a dovish Fed chair will get all this back on the right track.
41% of COMEX’s Silver Is Spoken For, Rumor Is China May Be A Large Part Of That Drain, Banks Tap 2nd Largest Liquidity Injection Since COVID and 38.5 Billion Total Yesterday, Japanese Rates Continue To Rise, Are Metals Warning Of Global Leverage Unwind Via Yen Carry Trade?
Physical silver is vanishing, bullion banks are scrambling for cash, China may be quietly draining the vaults, and Japan—the linchpin of the global leverage machine—is flashing red. Rising JGB yields threaten the yen carry trade, and gold and silver are behaving like accelerants poured on a debt-soaked financial system. The pressure is building.

🚨About 26% of COMEX Available Silver Was Just Claimed. SHFE Silver At Lowest Levels Since July 2016. Gold And Silver Are Warning Of A Major Risk-Off Event. Bitcoin Performing Like A Risk-On Asset, Not A Store of Value.
Physical inventories are draining, collateral is tightening, and real stores of value are screaming danger while speculative assets buckle under leverage.